Radiology Rounds 12: Centrilobular Emphysema

1

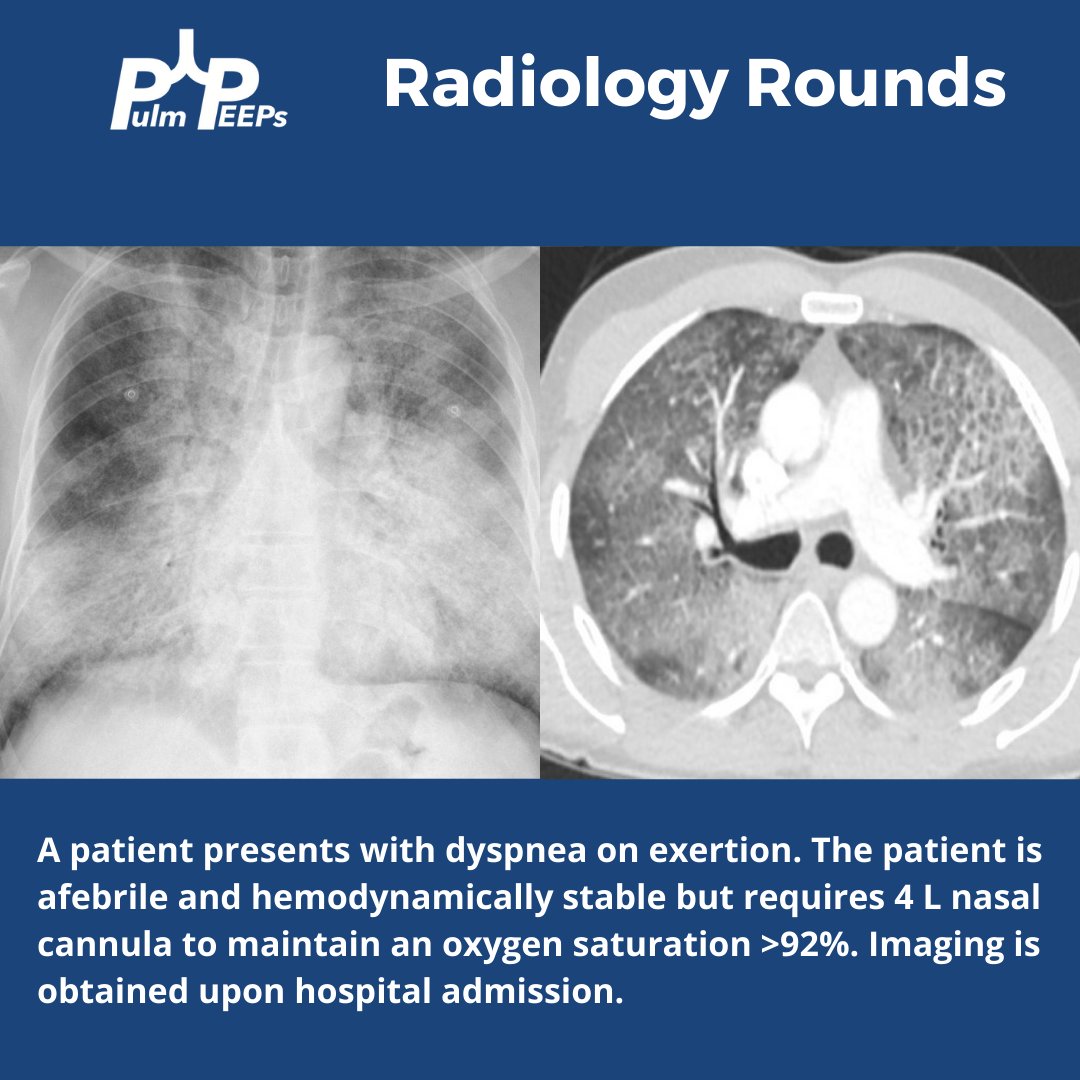
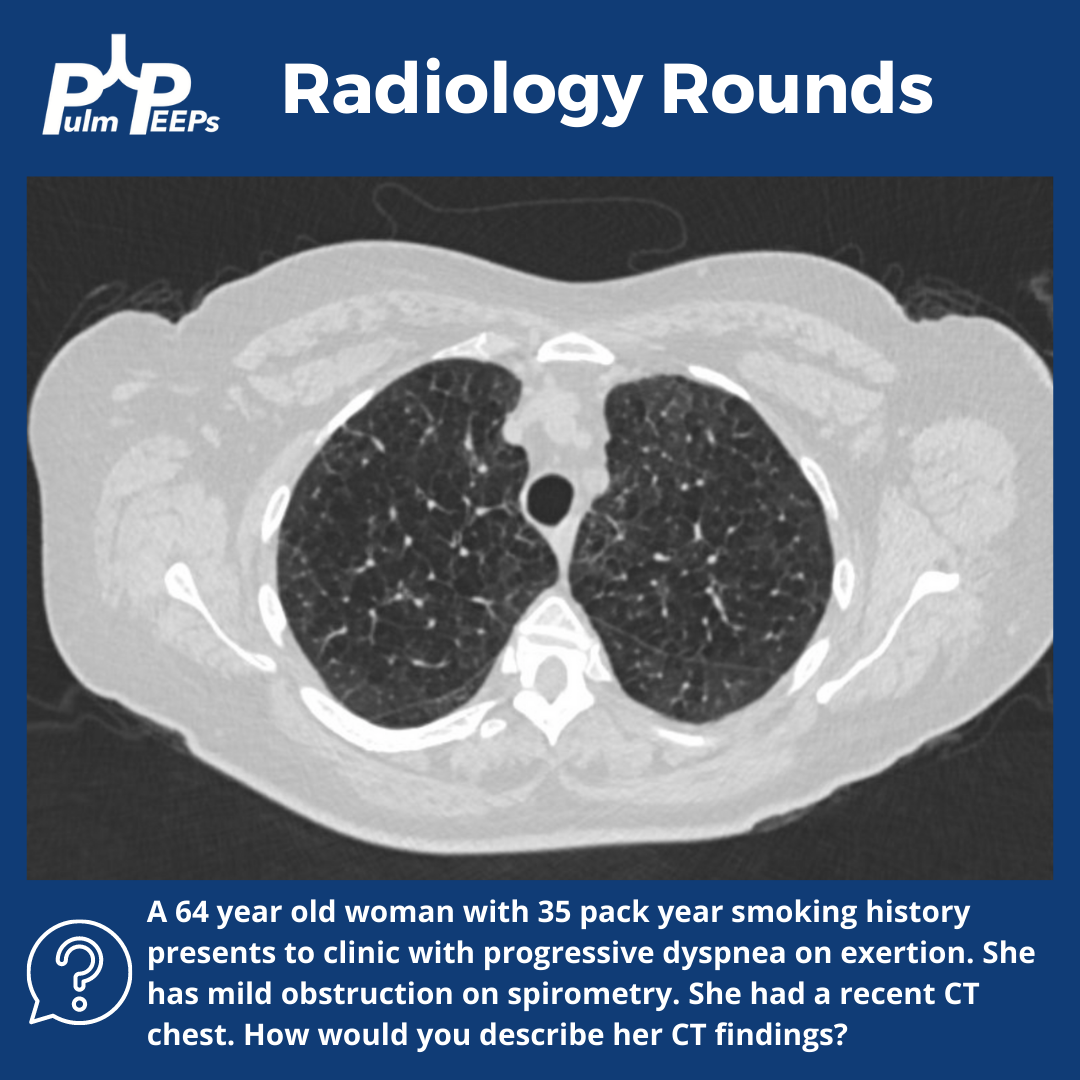
This week on #RadiologyRounds we continue our series on COPD. Make sure to listen to all our episodes made in collaboration with the ATS Clinical Problems Assembly.
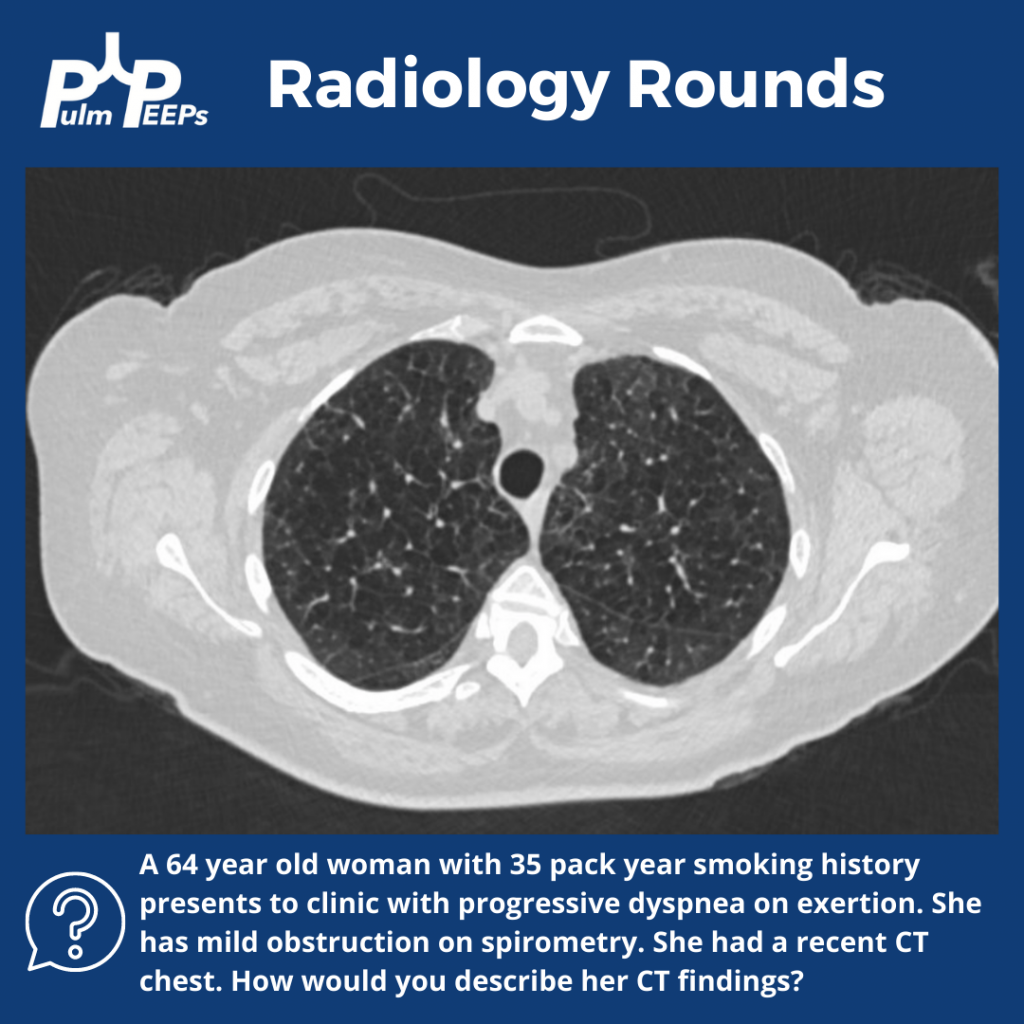
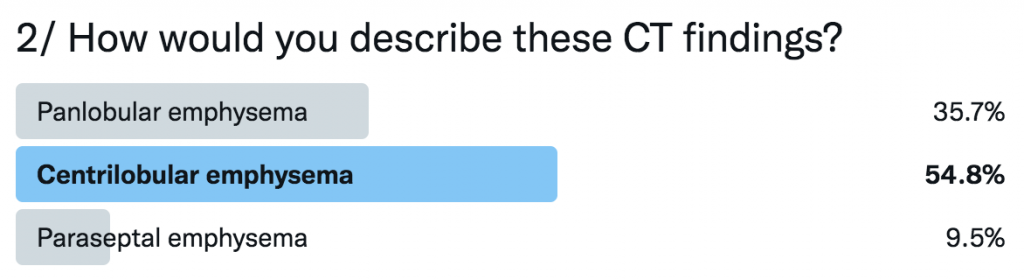
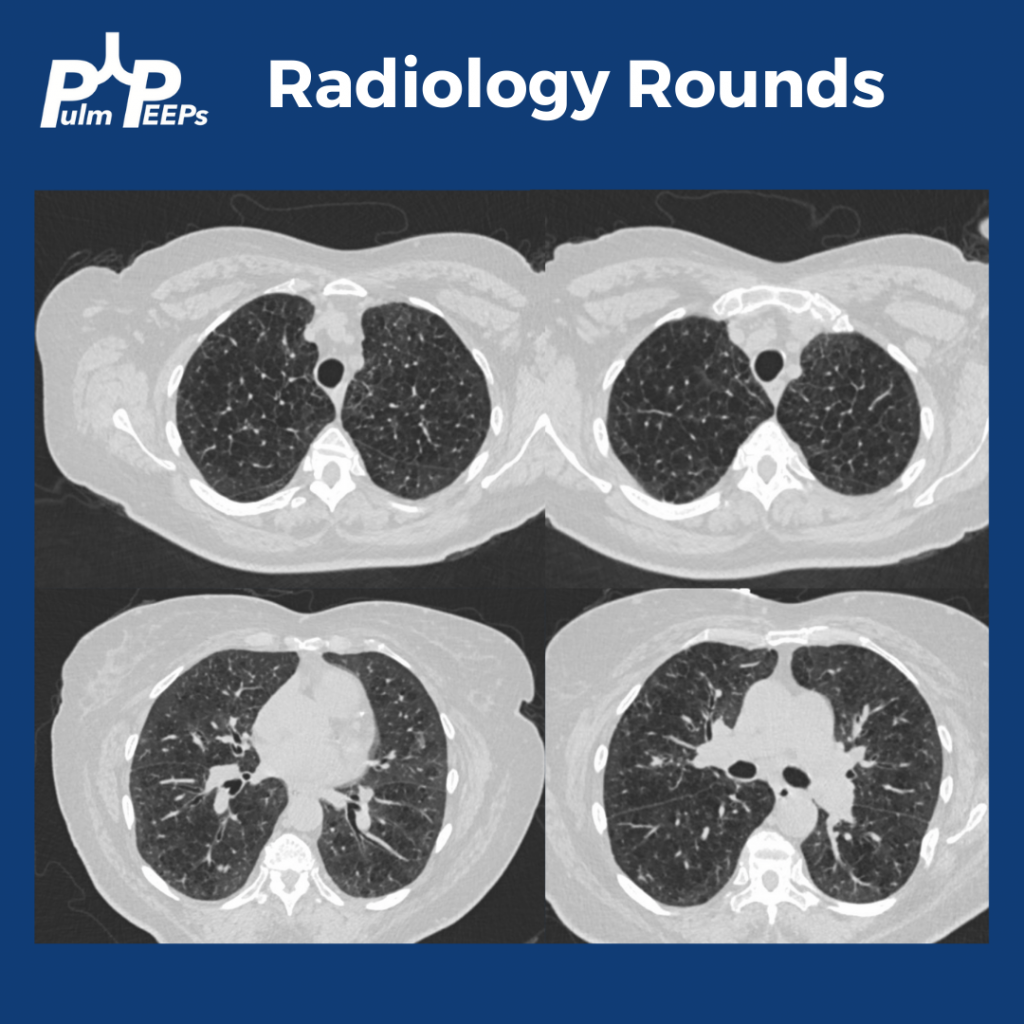
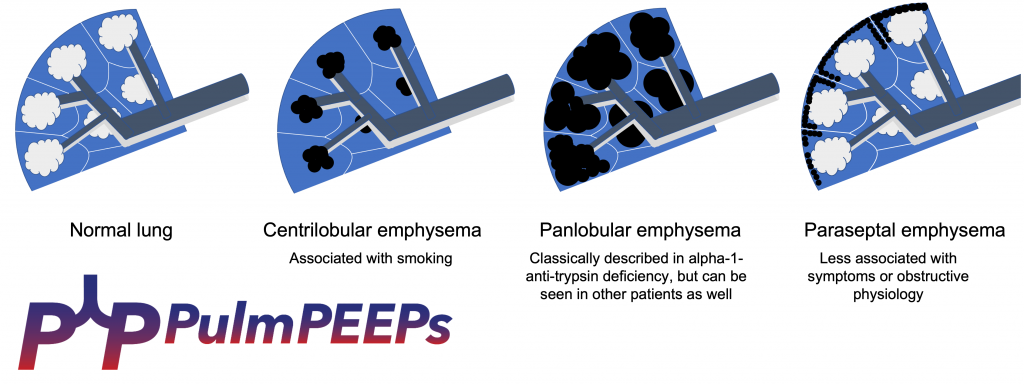
The CT shows moderate to severe centrilobular emphysema. These different patterns of emphysematous changes on CT can be related to the underlying driver of the disease and to symptom and disease severity.
In terms of follow-up, would you test this patient for alpha 1 anti-trypsin deficiency?
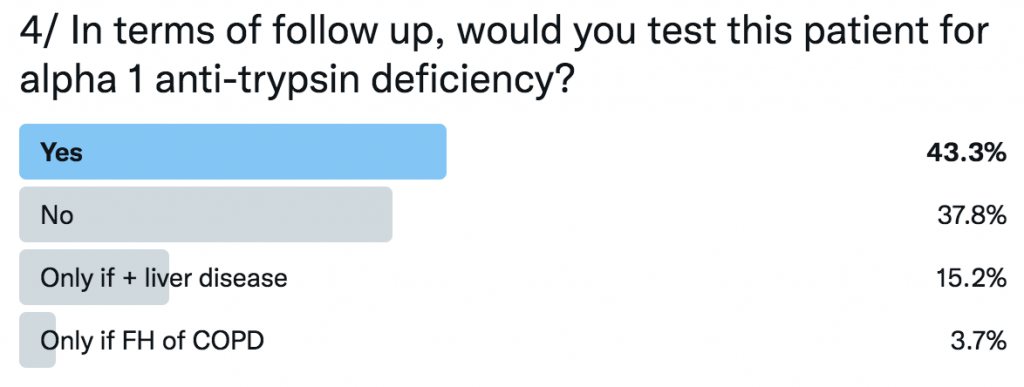
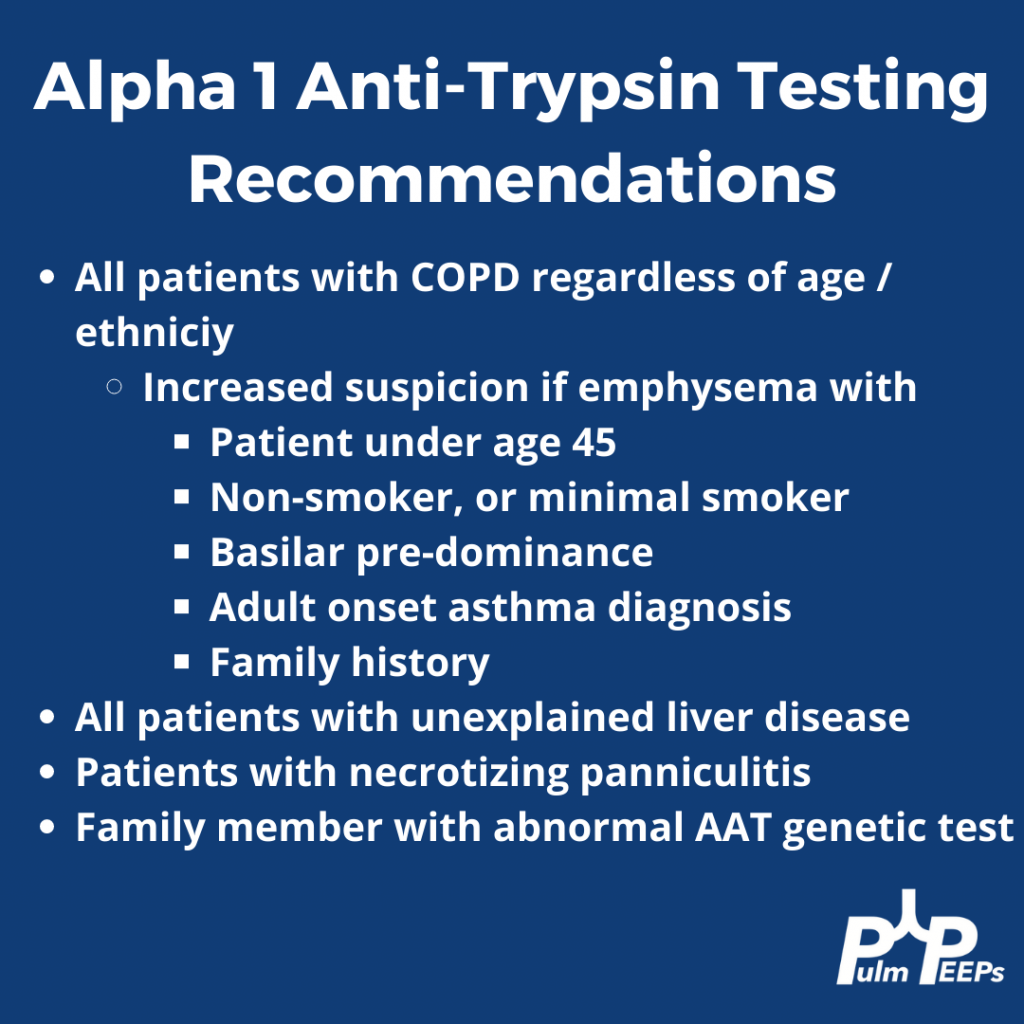
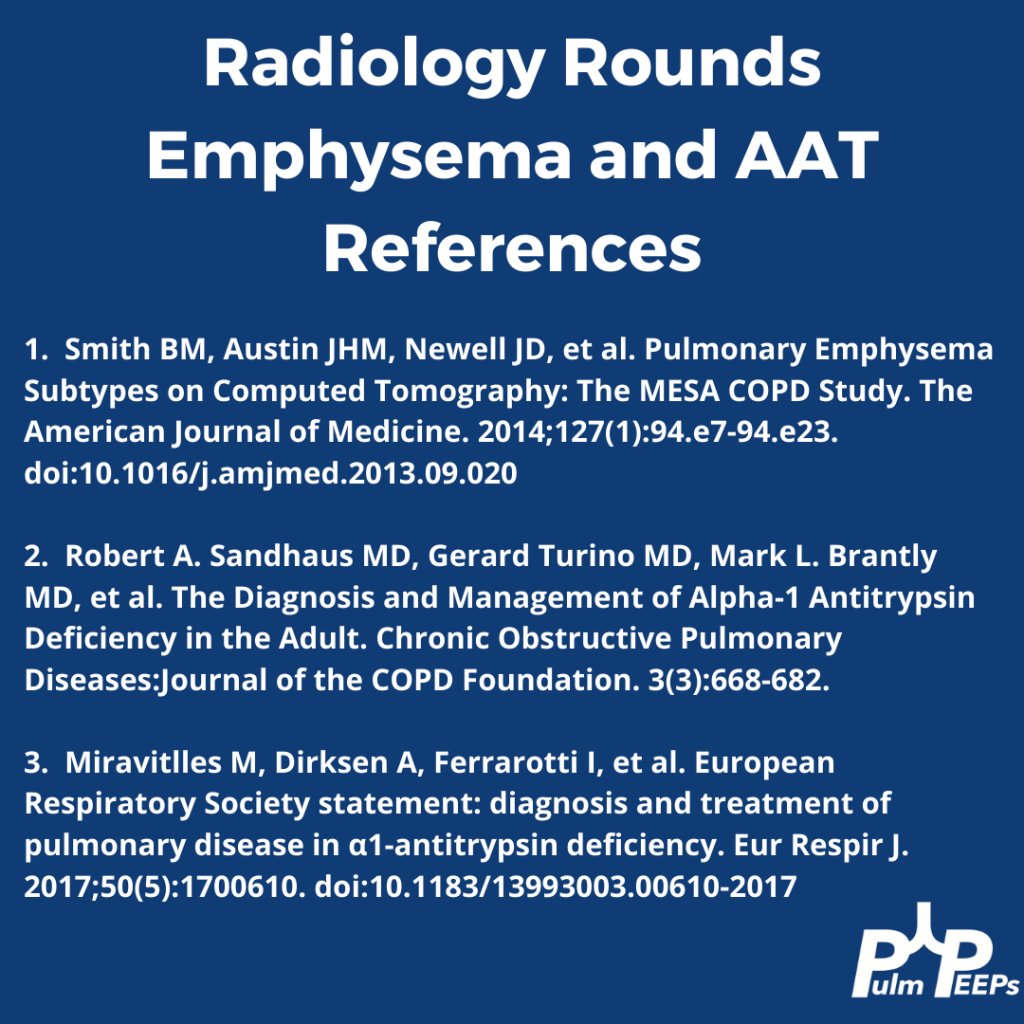
Current GOLD guidelines recommend that everyone with COPD, regardless of age or ethnicity should be tested for alpha 1 anti-trypsin deficiency.
Radiology Rounds 11: Sarcoidosis

FPl2XDLXsAM5YFG

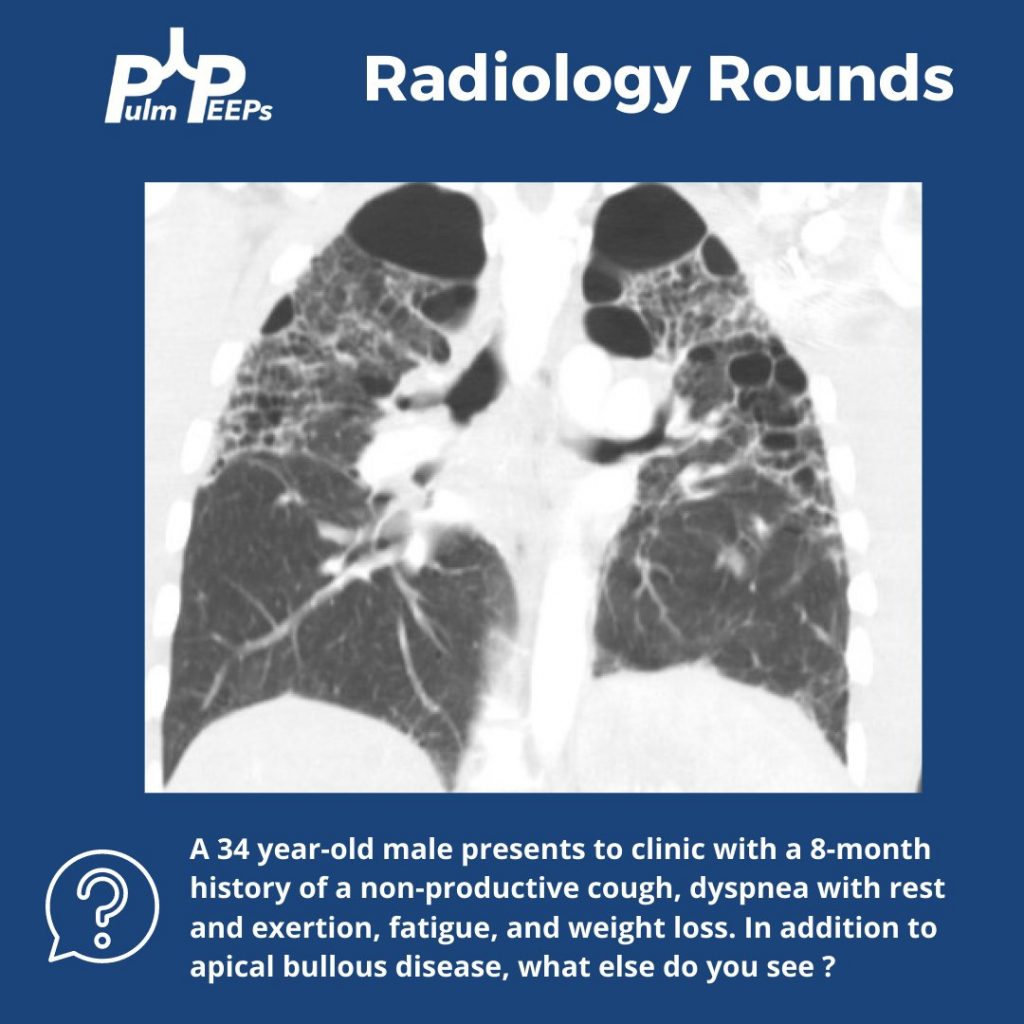
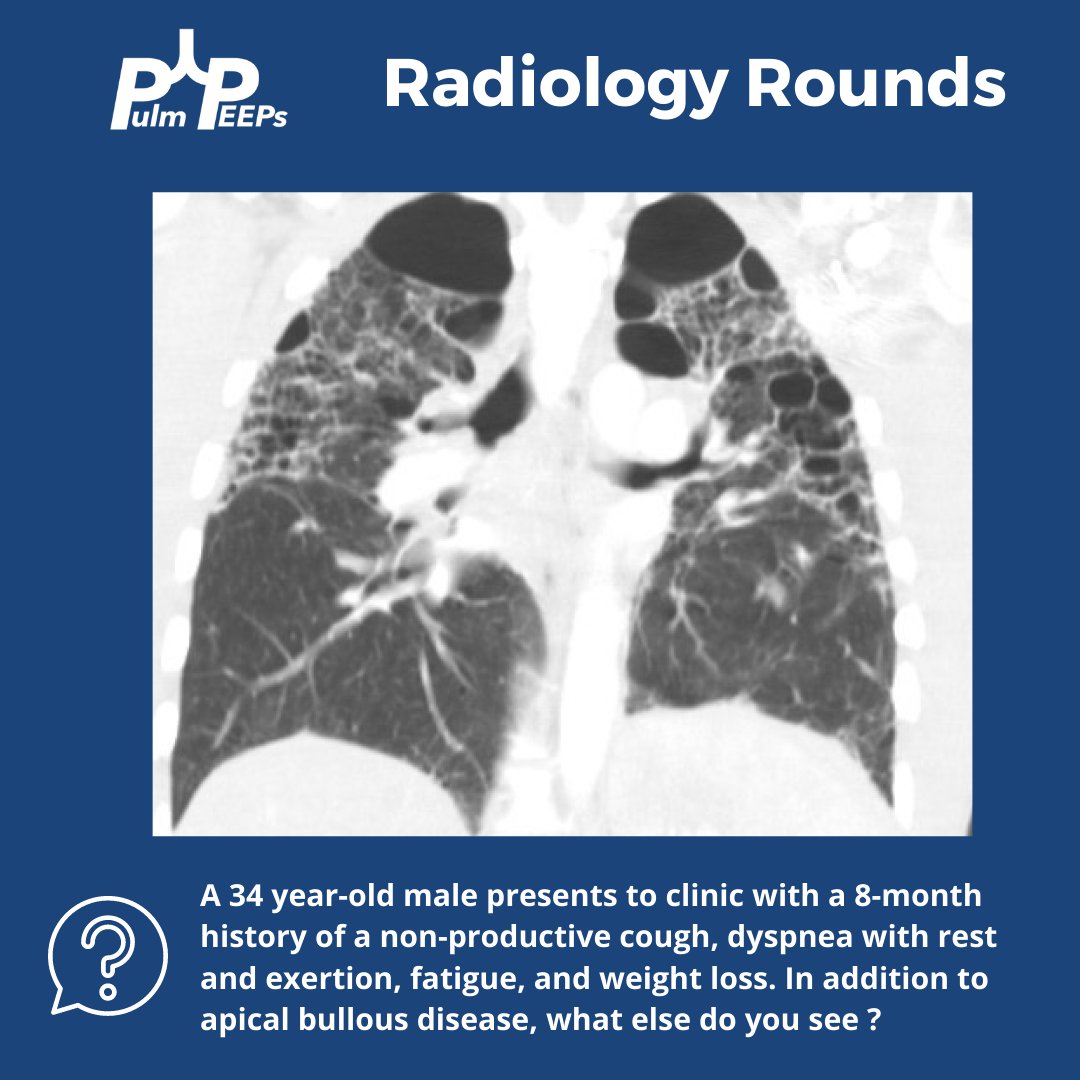
We have another #RadiologyRounds for you today! You are seeing a new patient in the clinic with dyspnea who brings in prior CT chest imaging. A representative coronal image is shown.

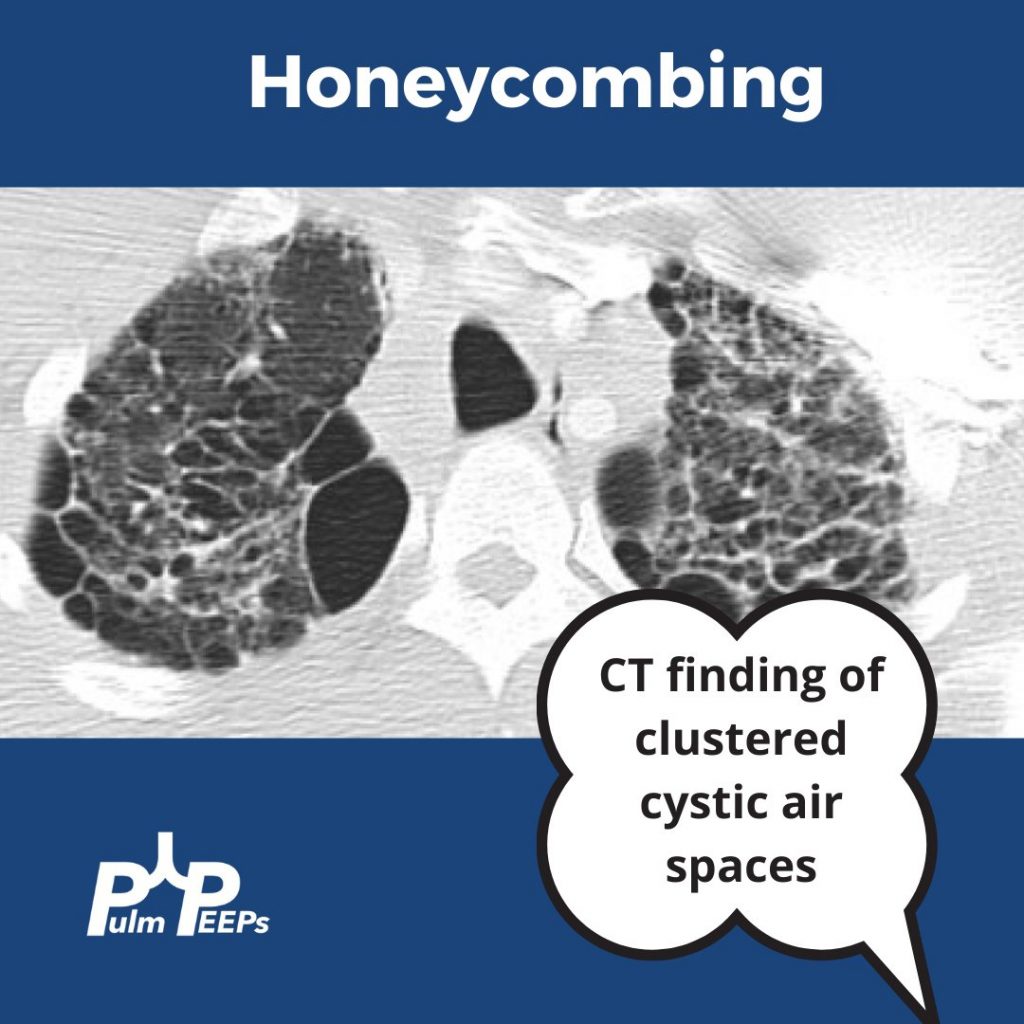
In addition to bullous disease, you see bilateral honeycombing with evidence of fibrosis primarily in the upper lung fields.

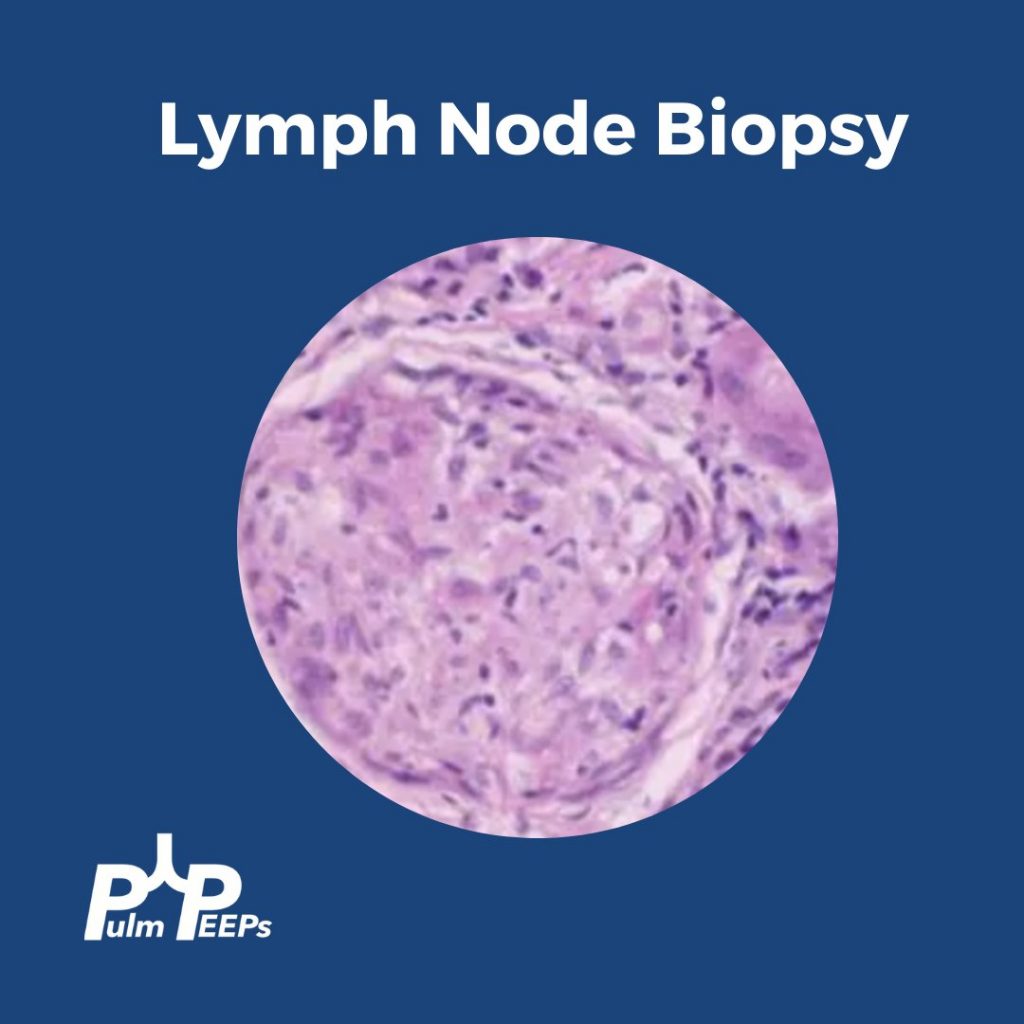
As part of your evaluation, an EBUS is performed showing the following representative lymph node tissue pathology.
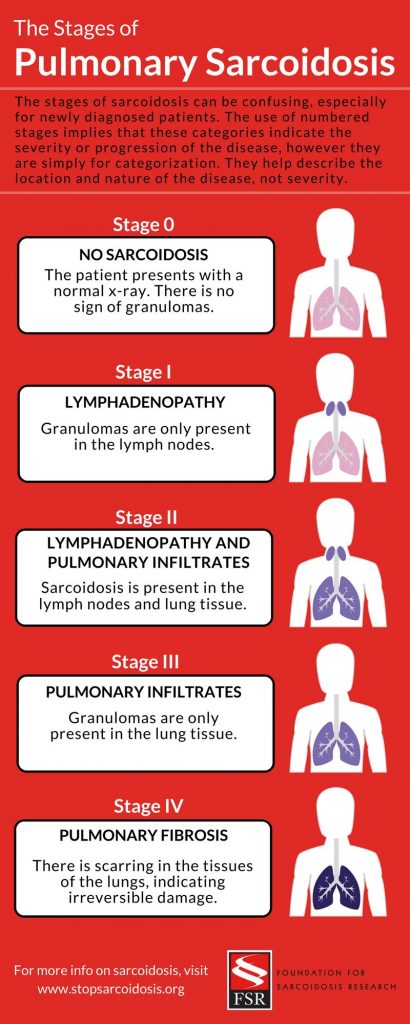
We had evidence of noncaseating granulomas, evidence of fibrocystic changes on chest imaging, and we excluded other causes of granulomatous disease. Given his symptoms and clinical context, we were concerned about Stage IV pulmonary sarcoidosis which can be categorized below.
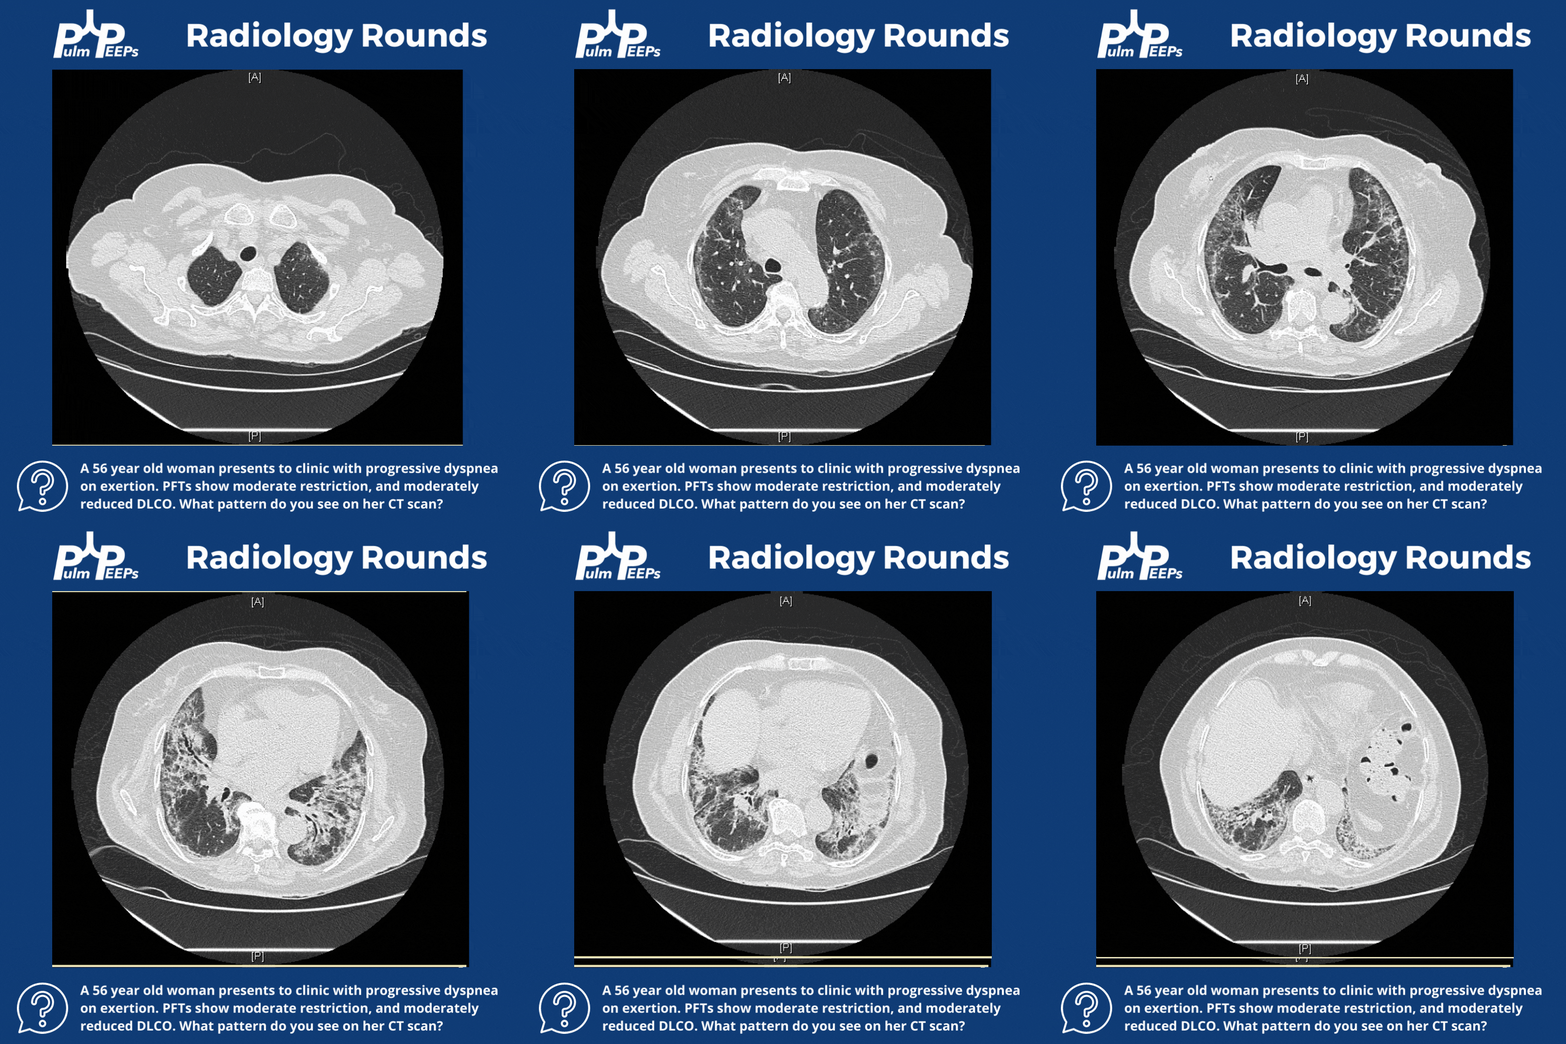
Image source: https://www.stopsarcoidosis.org/stages-of-sarcoidosis/

Radiology Rounds 10: Pulmonary Arterial Hypertension – CT Signs

1

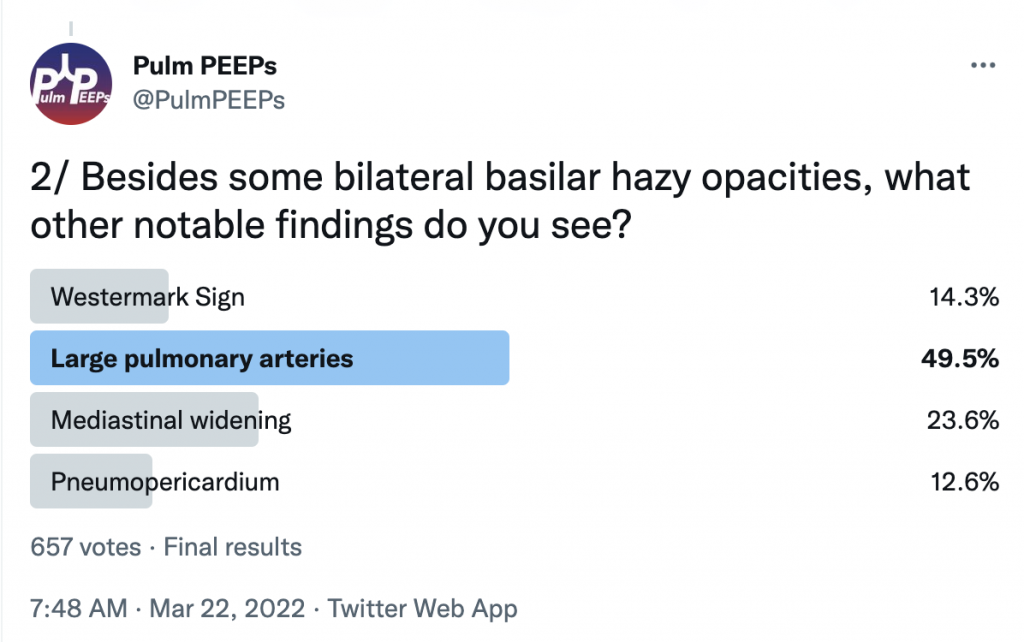
For Radiology Rounds this week we’ll be looking at multiple imaging modalities to help solve the case. Please follow along on Twitter for our live polls and for ongoing discussion of the case.

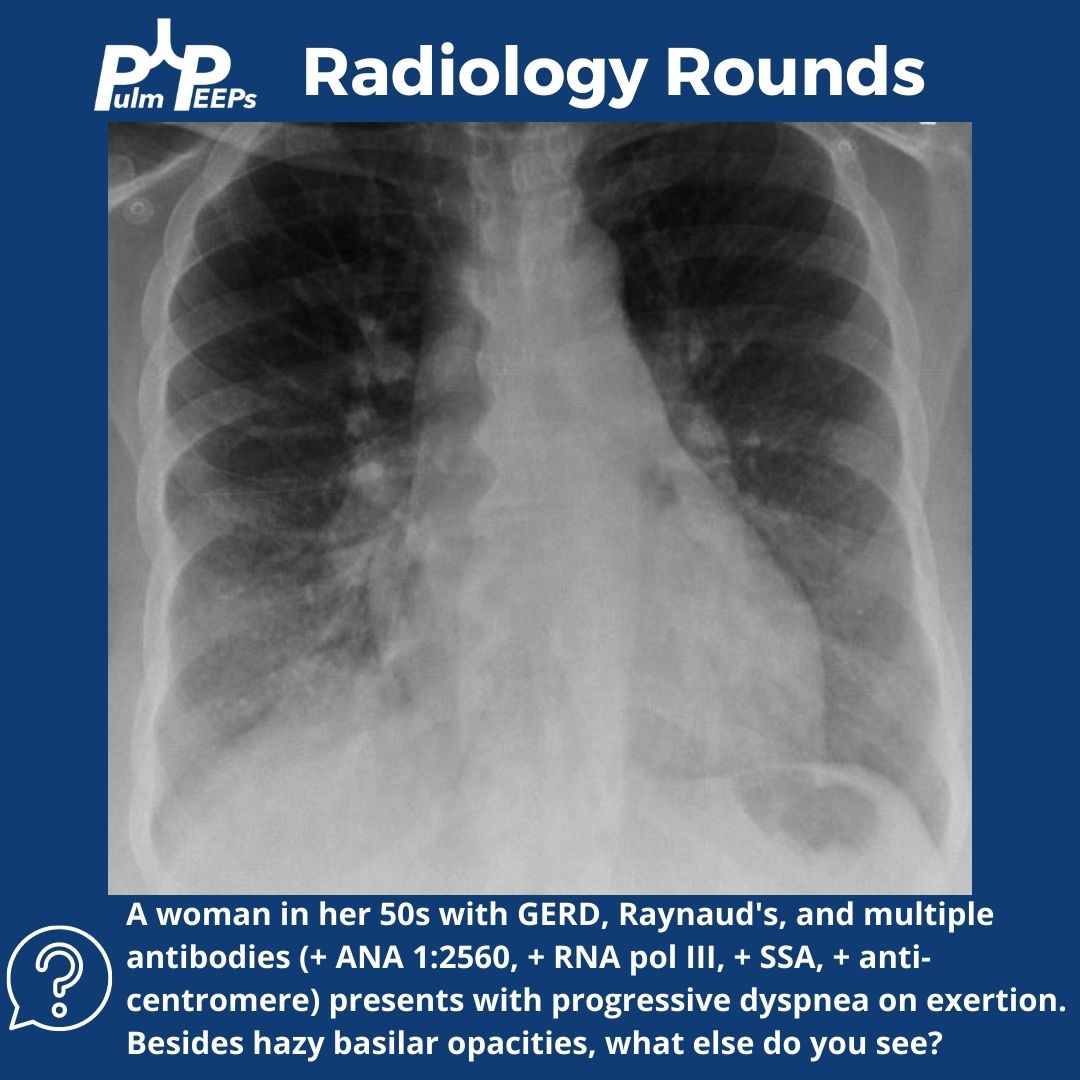
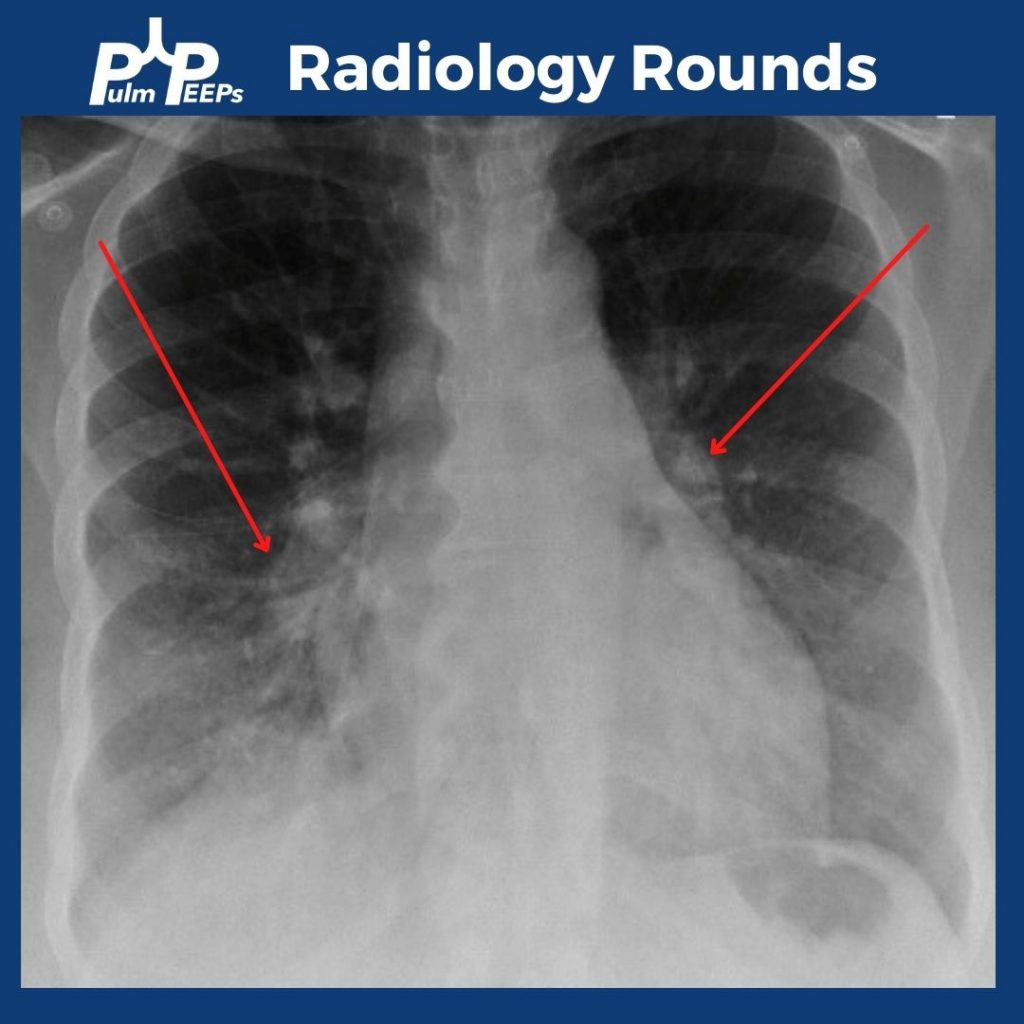
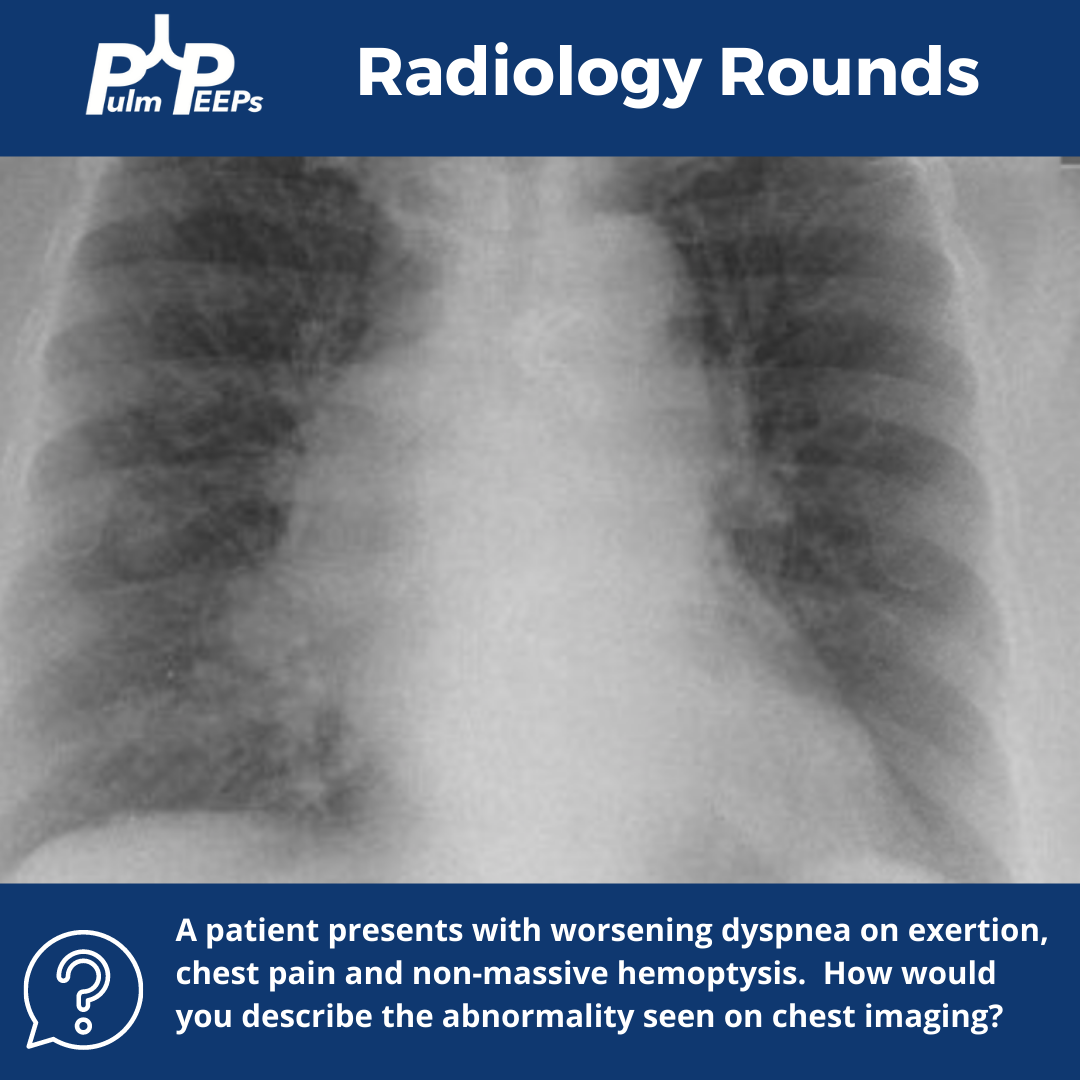
In addition to bibasilar opacities, the CXR shows bilateral enlarged pulmonary arteries.

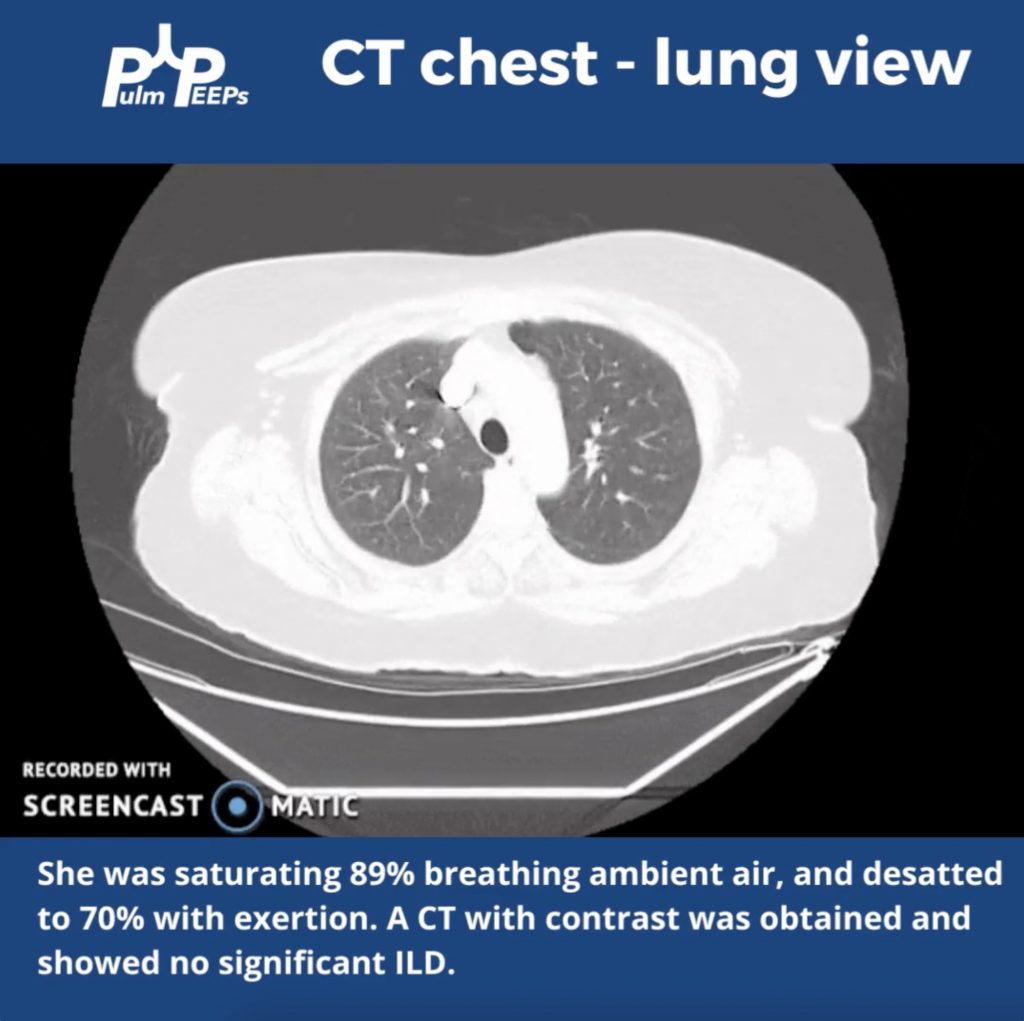
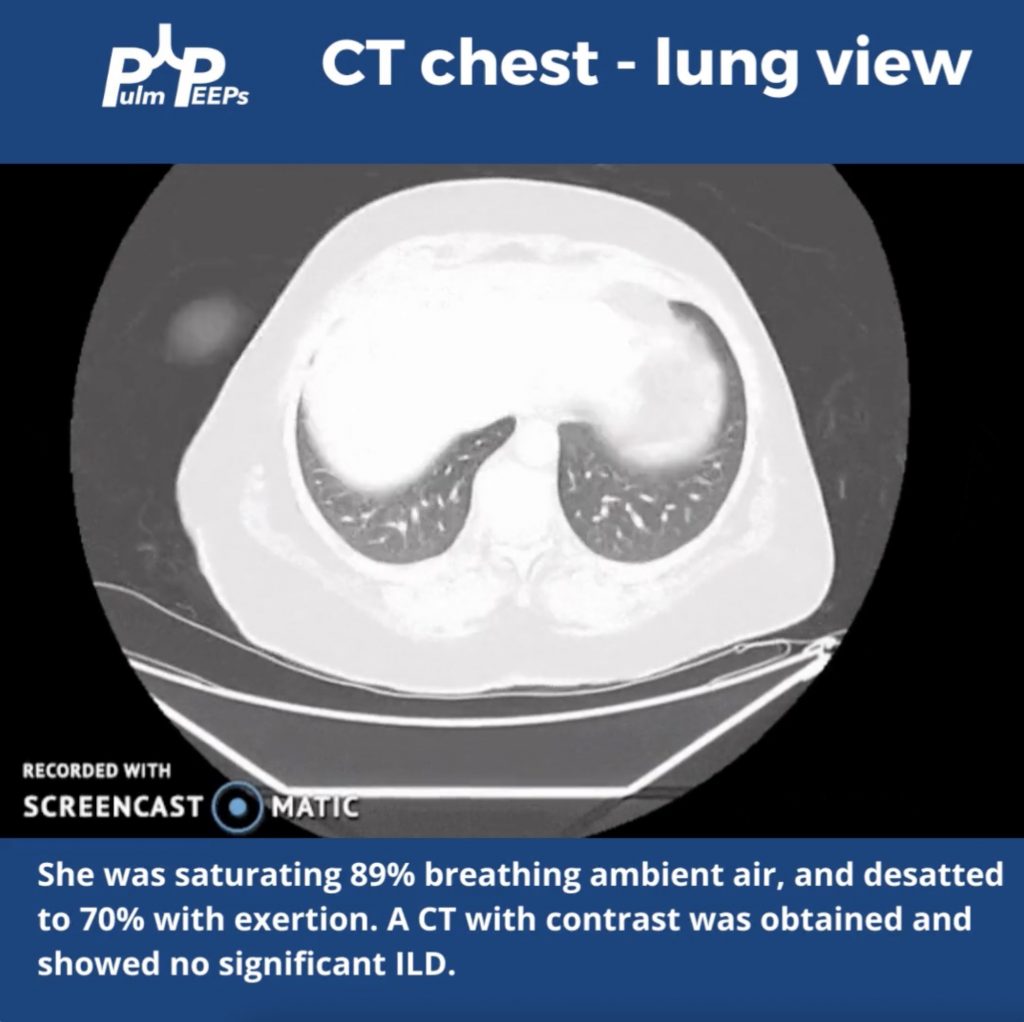
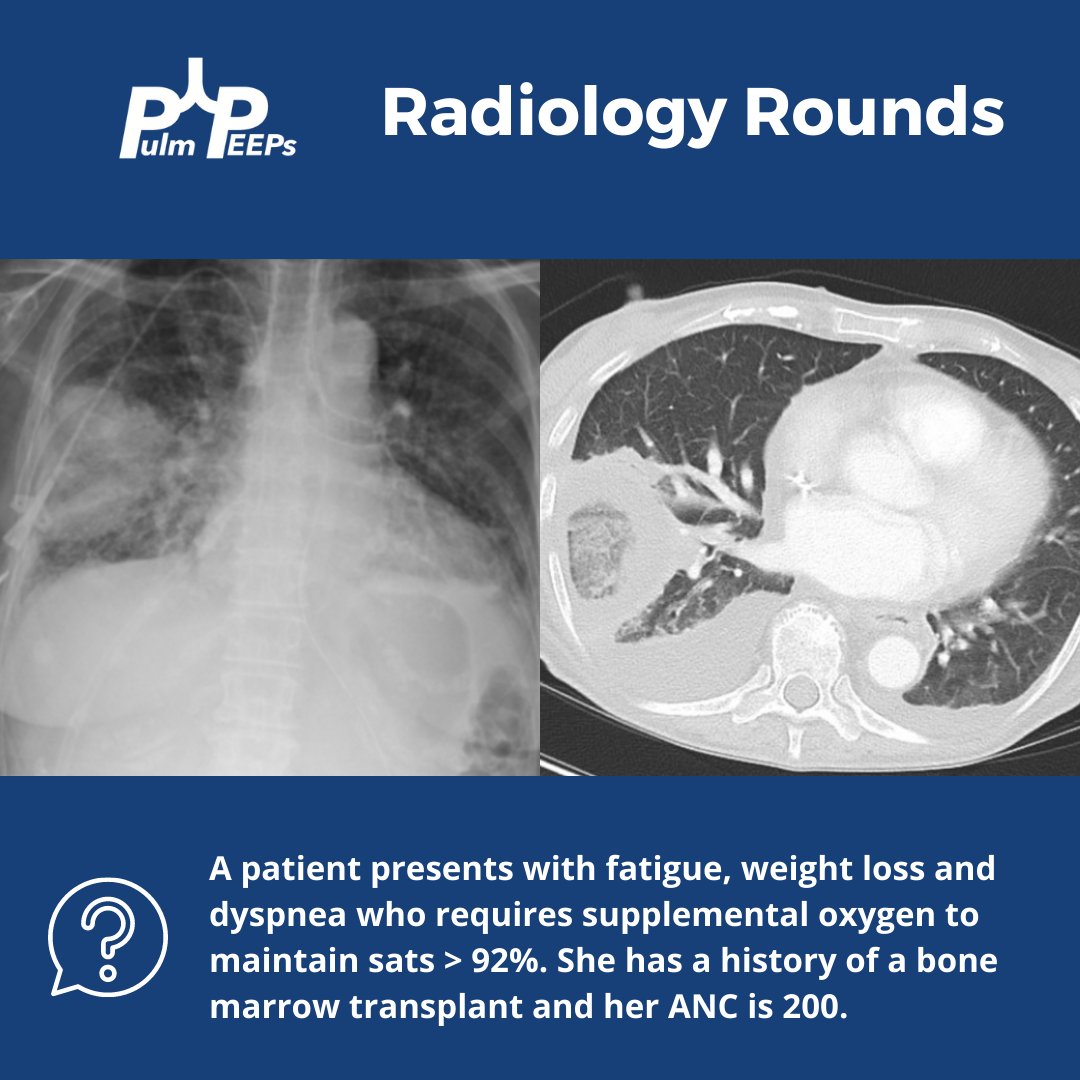
The patient was hypoxemic on room air and desatted into the 70s with ambulation. Given her possible connective tissue disease a CT chest was obtained.

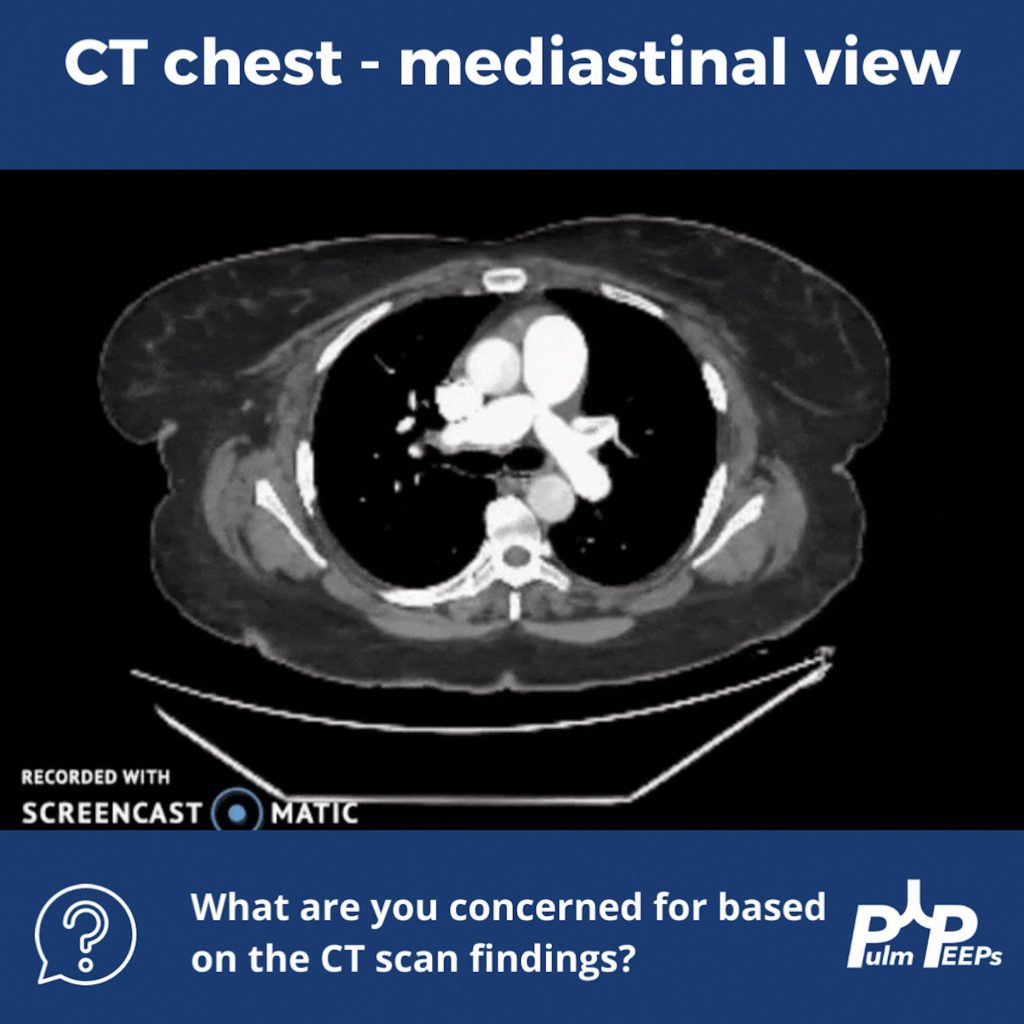
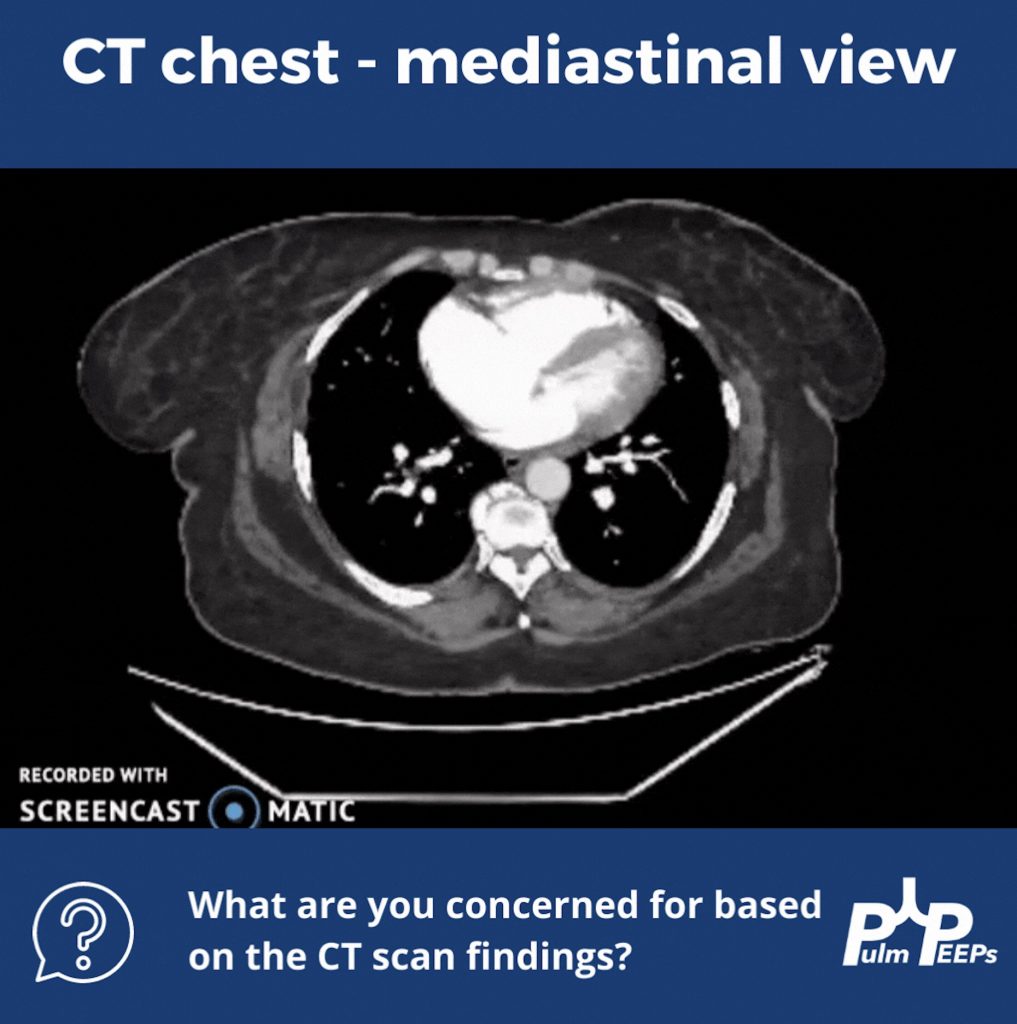
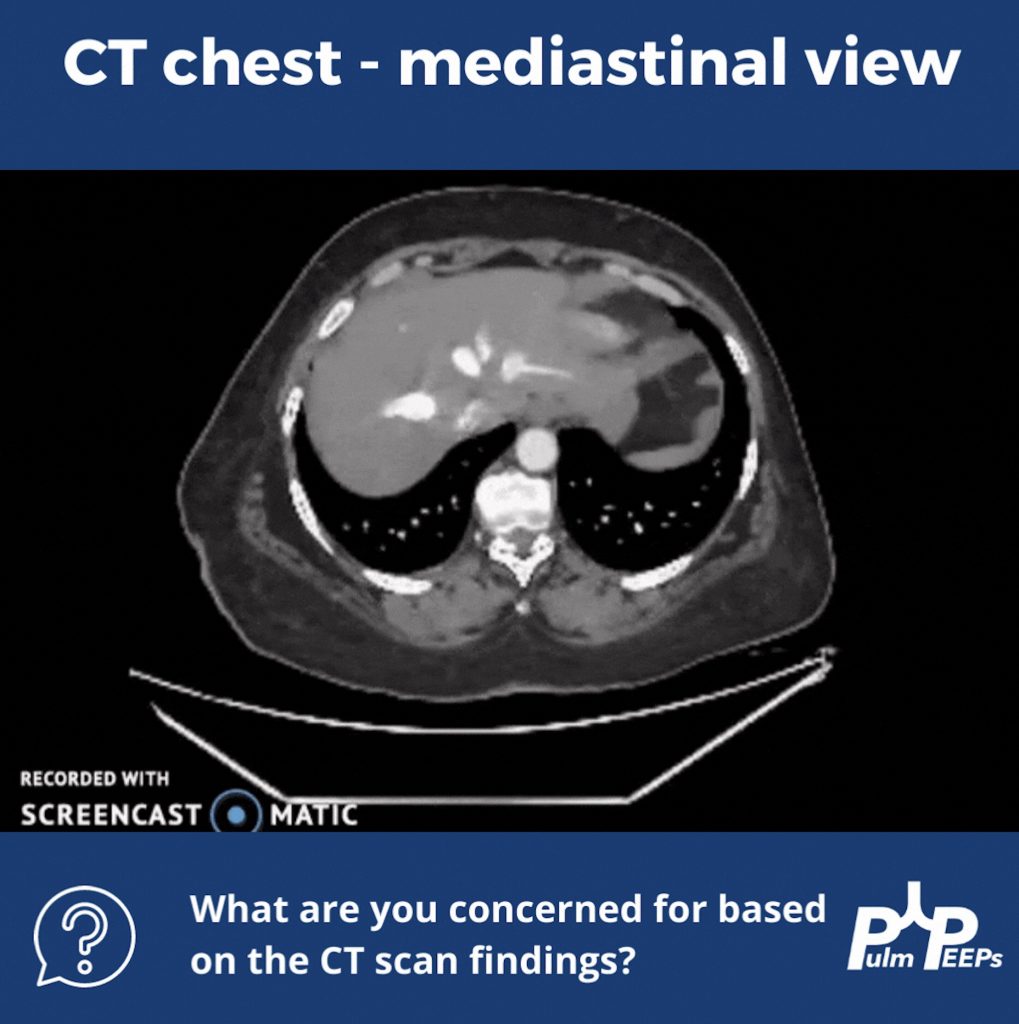
Although no ILD was revealed on the CT scan, let’s take a look at the mediastinal windows:

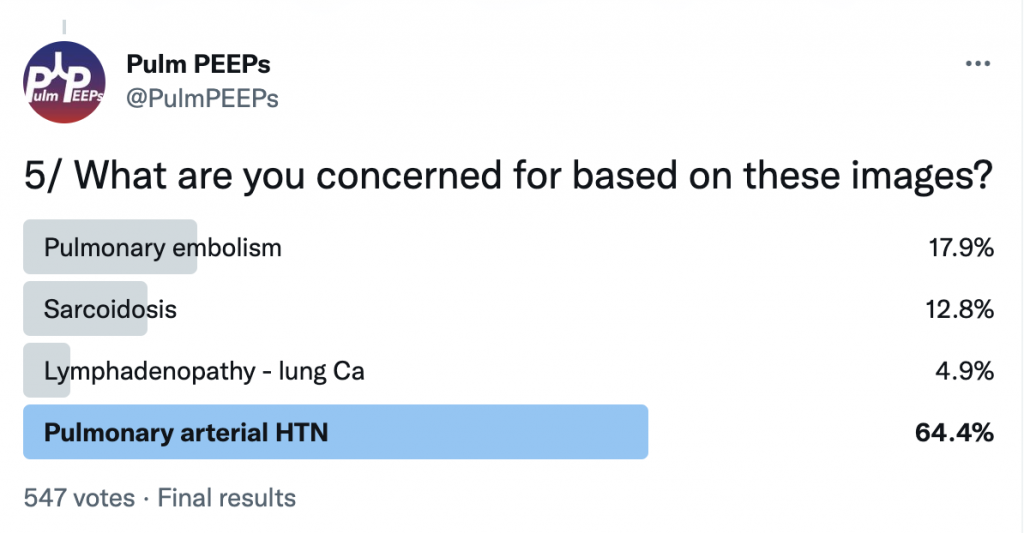
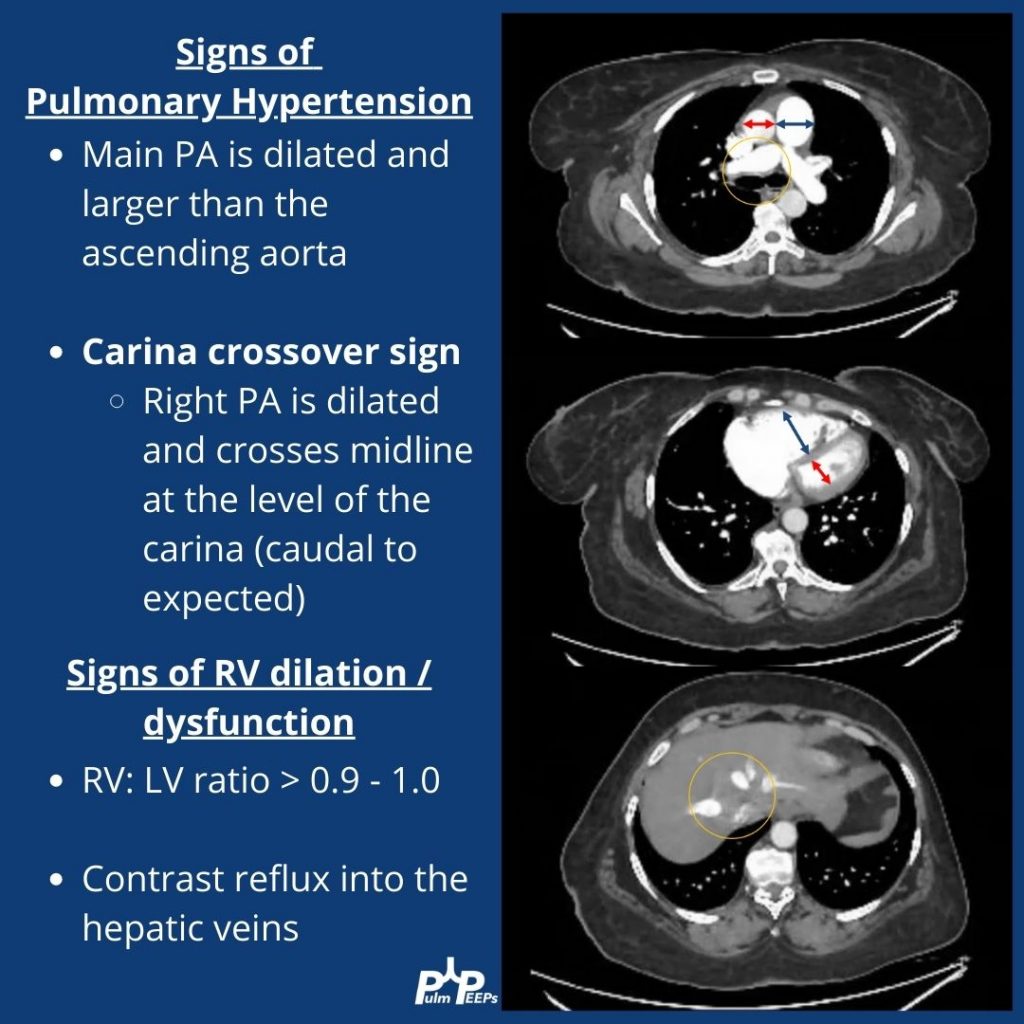
There are multiple signs of pulmonary hypertension, and right ventricular dilation and strain on this CT scan. Let’s review them:

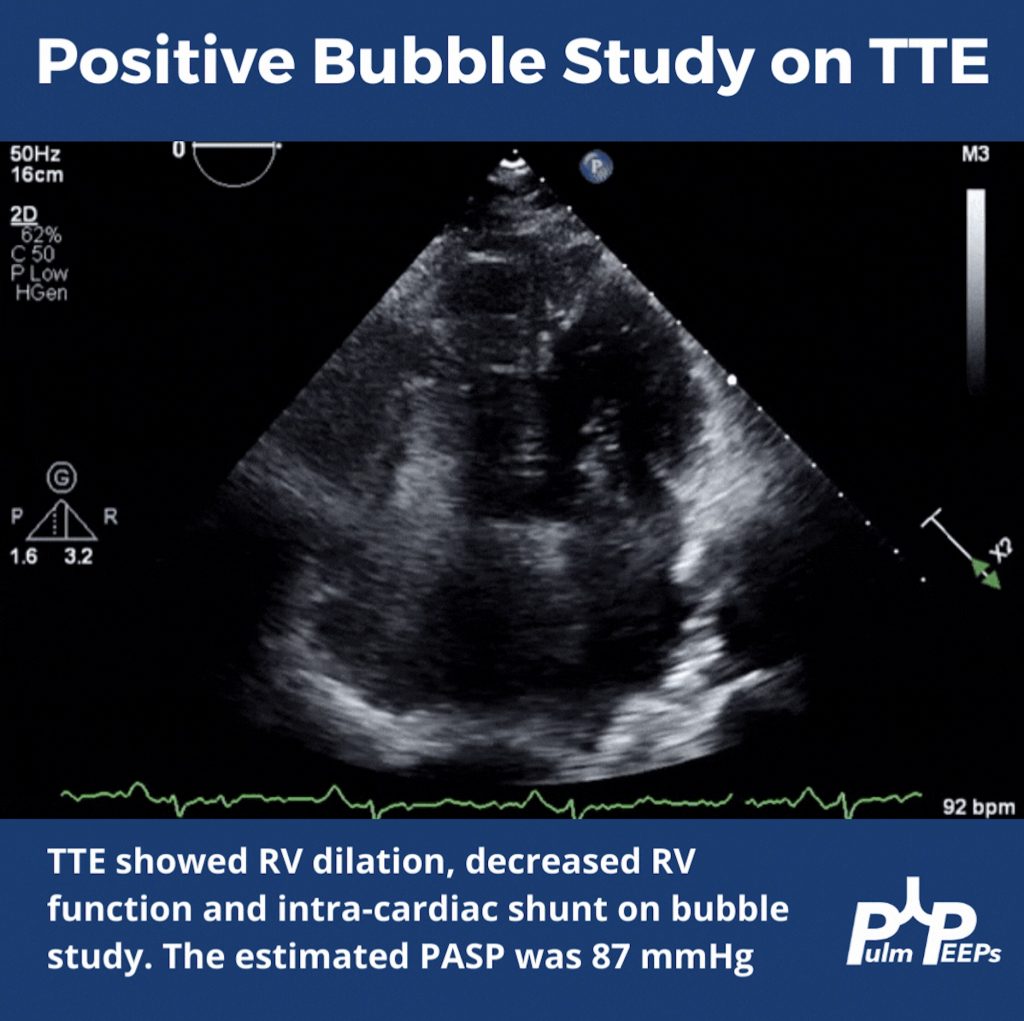
To help explain the patient’s hypoxemia, an ECHO with bubble study was ordered next

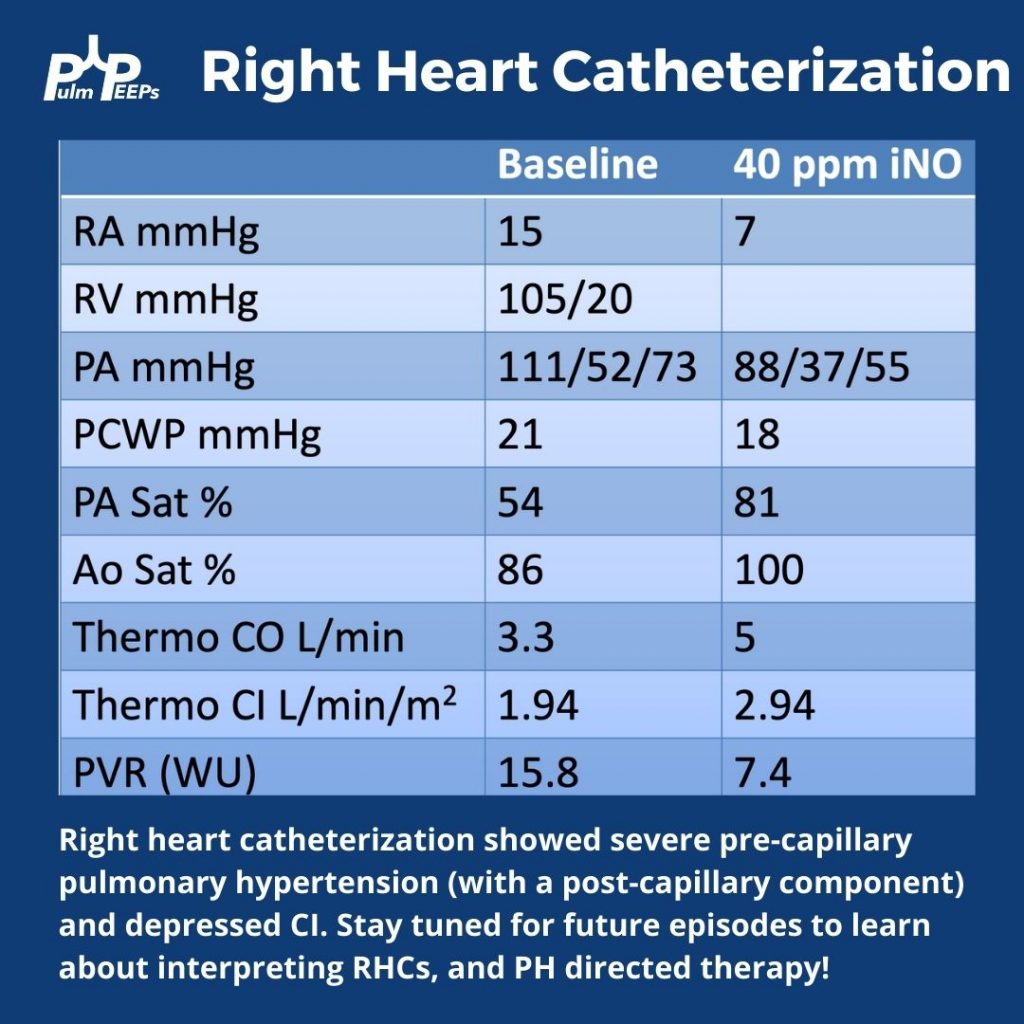
Since pulmonary hypertension can only truly be diagnosed on right heart catheterization, this was performed next and revealed severe pre- and post- (mostly pre)-capillary pulmonary hypertension

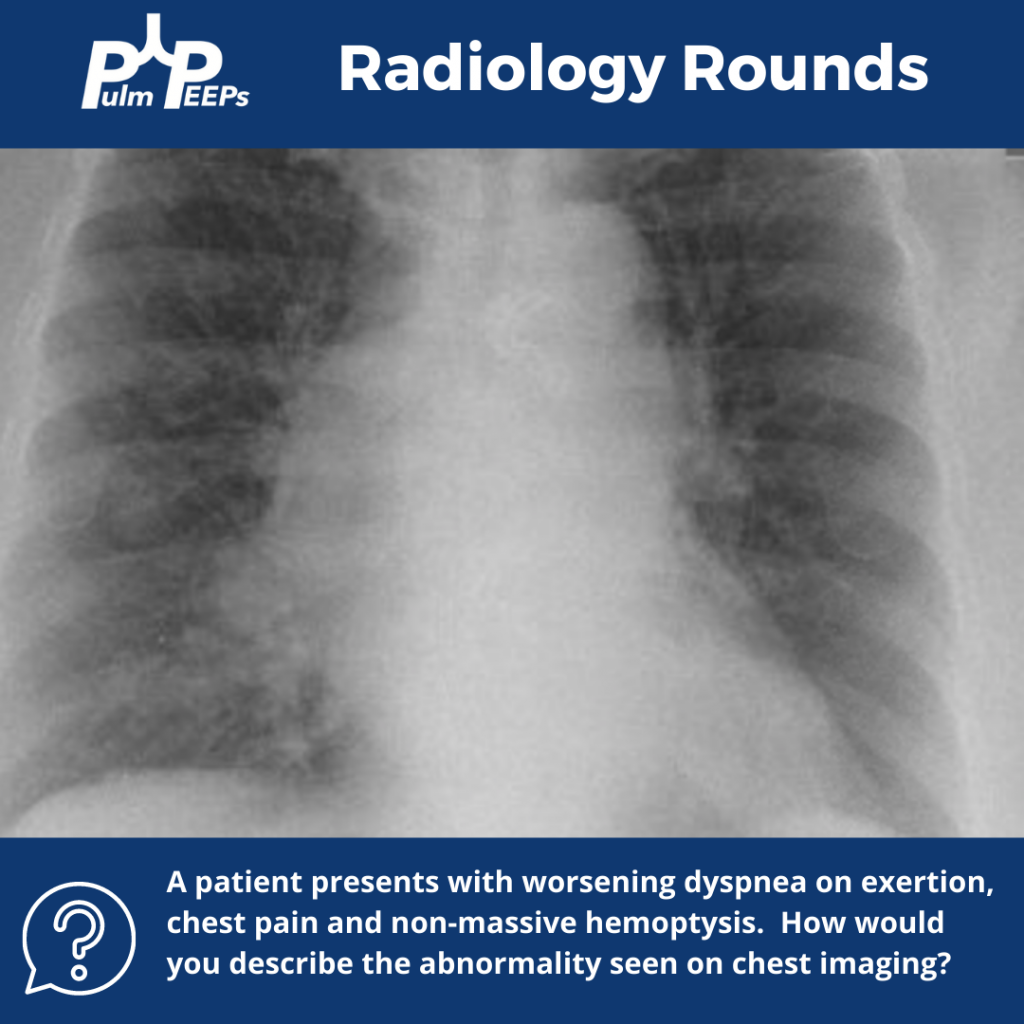
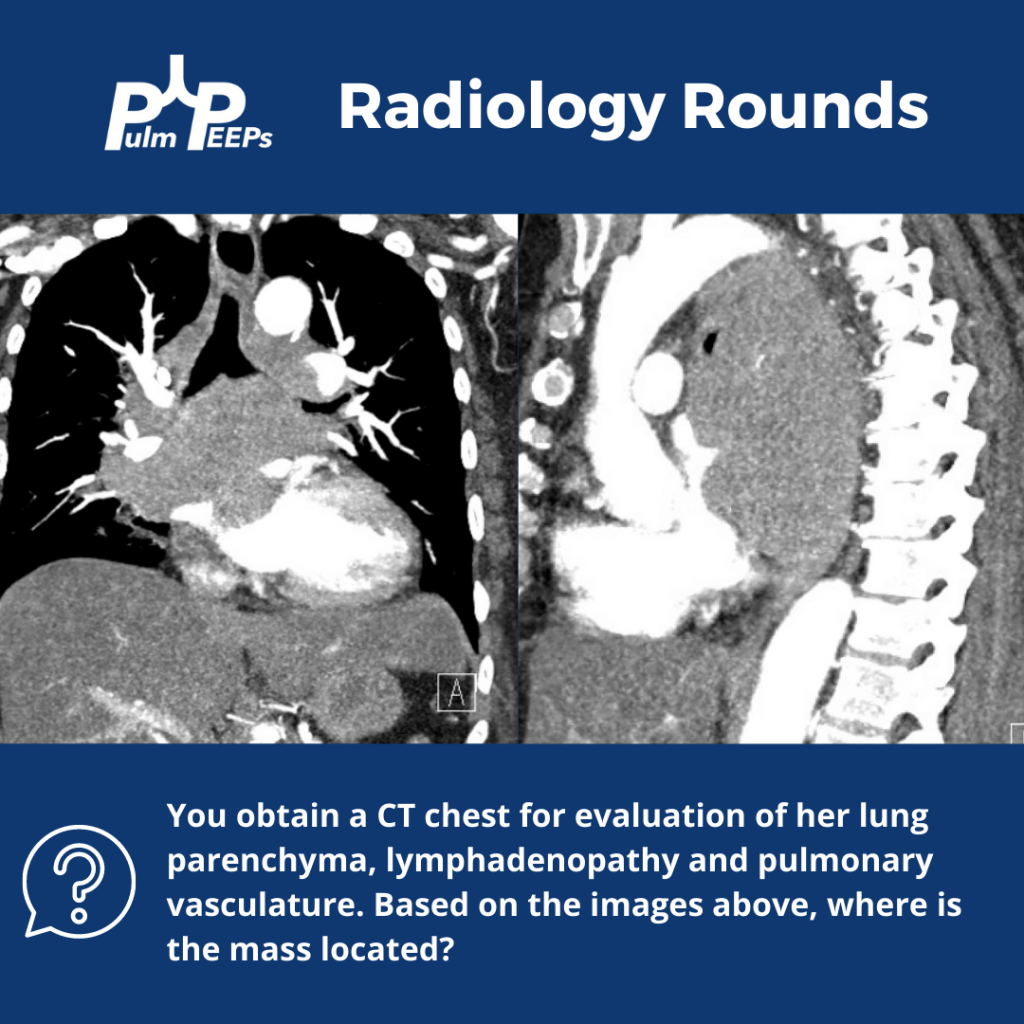
Radiology Rounds 9: Posterior Mediastinal Mass

1

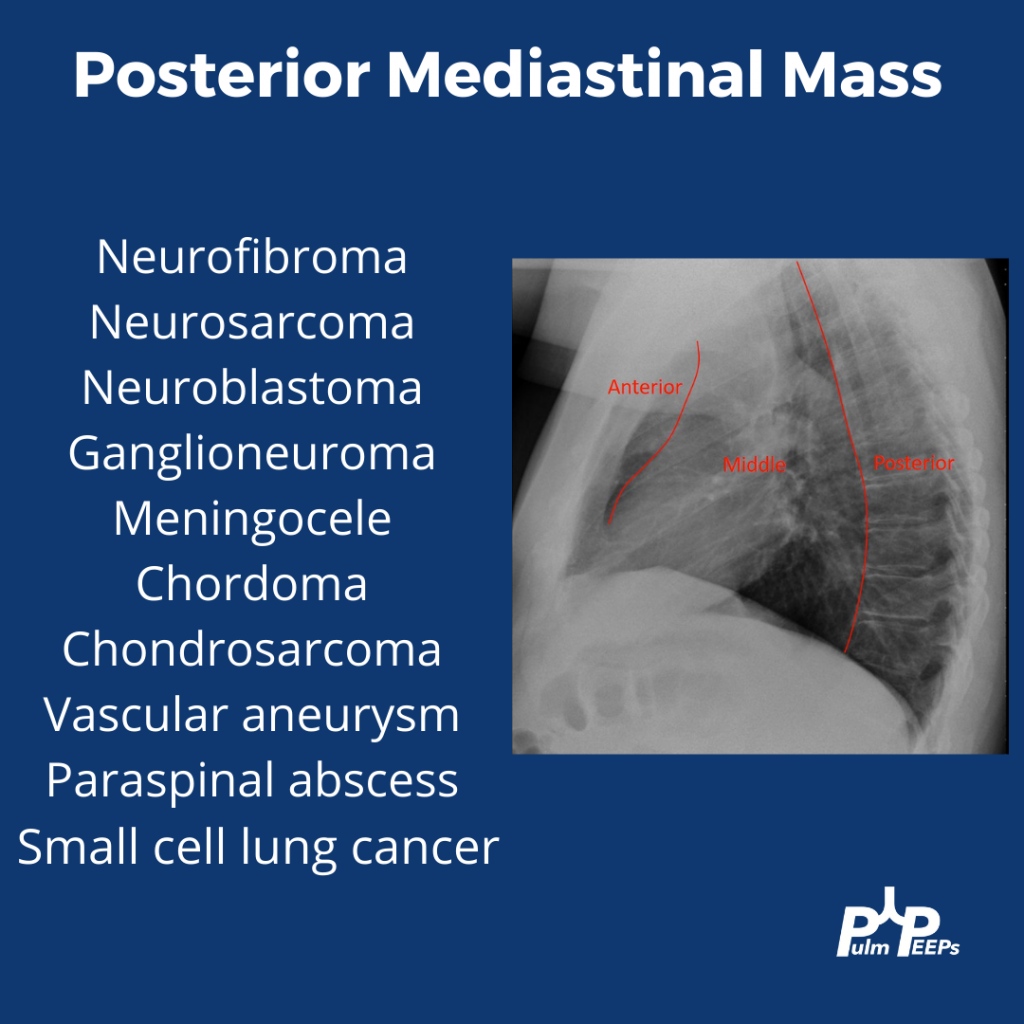
We’re excited to bring you another Radiology Rounds today that combines pulmonary and critical care.

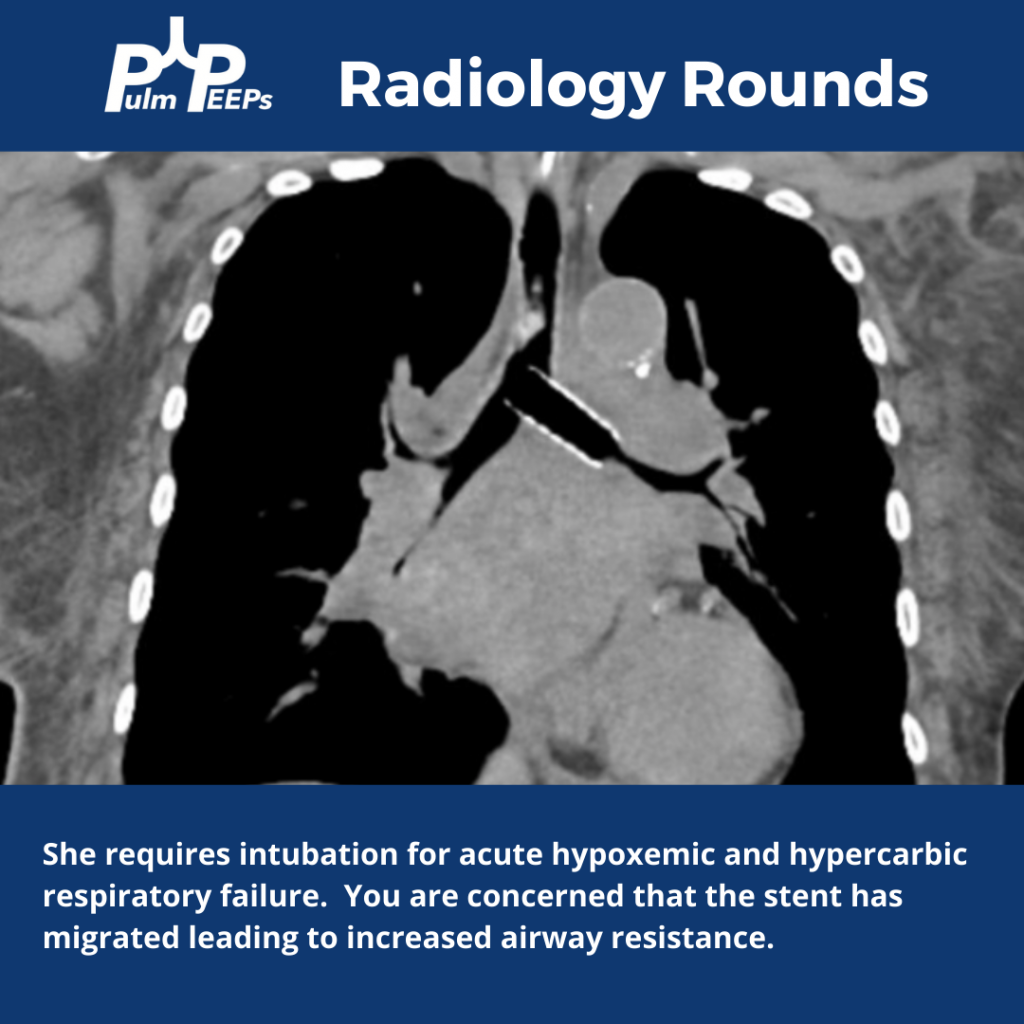
The patient is diagnosed with small cell lung cancer and requires a left bronchial stent. She develops acute hypoxemic and hypercapnic respiratory failure requiring intubation.

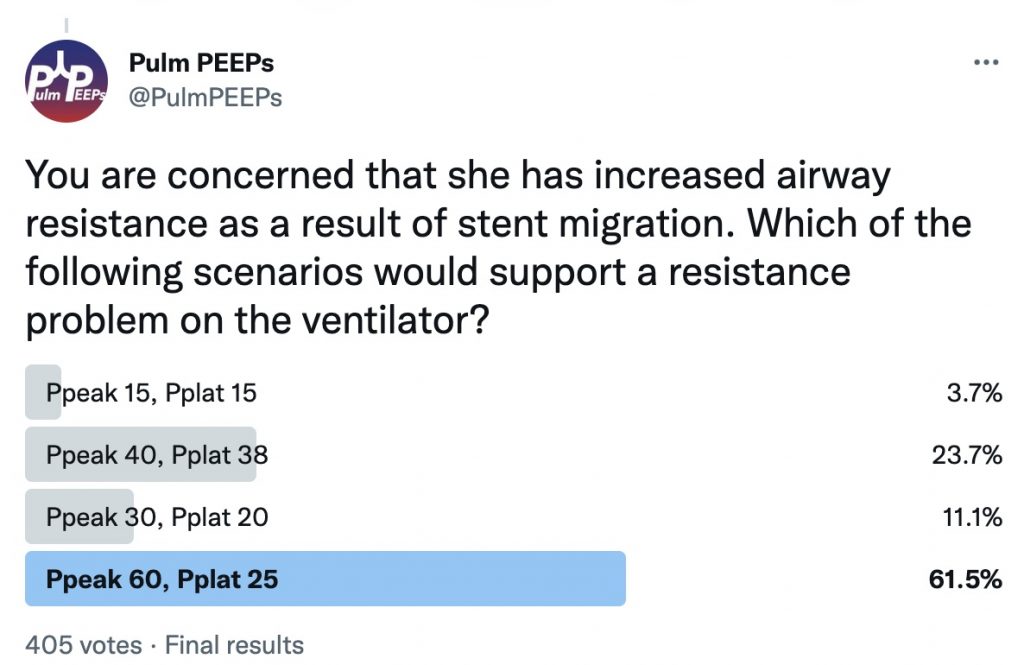
You are concerned that she has increased airway resistance as a result of stent migration. What would you expect to see on the ventilator if this is the case?

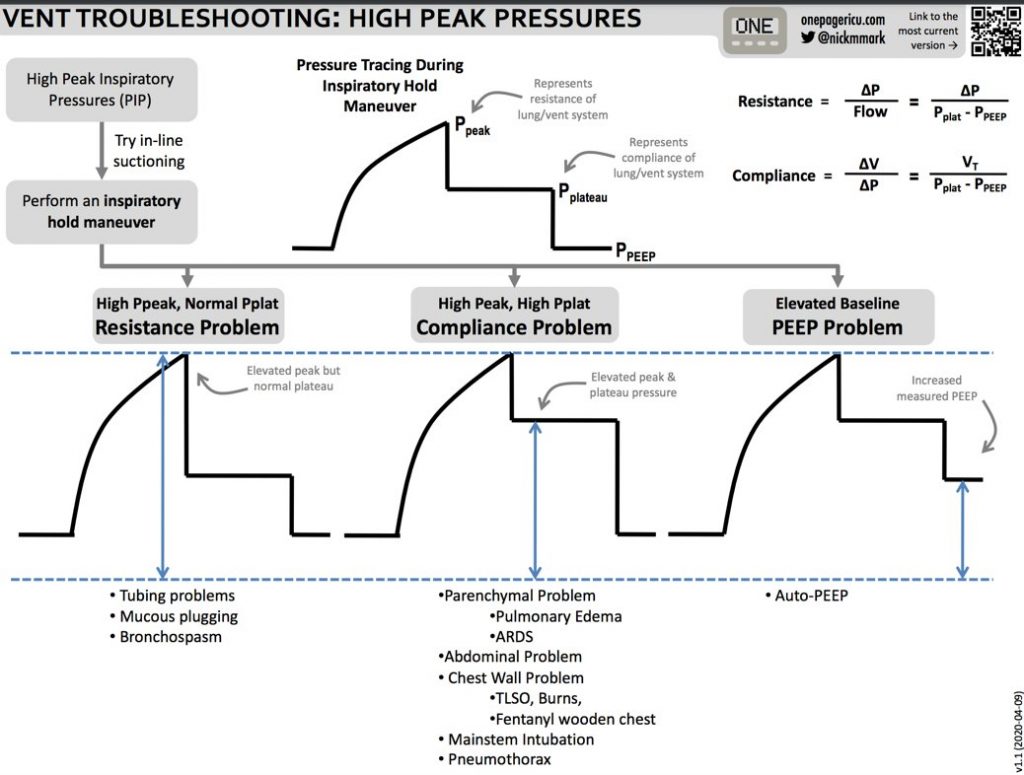
Here are some tips from ICU OnePager on interpreting high peak pressures on the ventilator

Radiology Rounds 8: Miliary Opacities

1

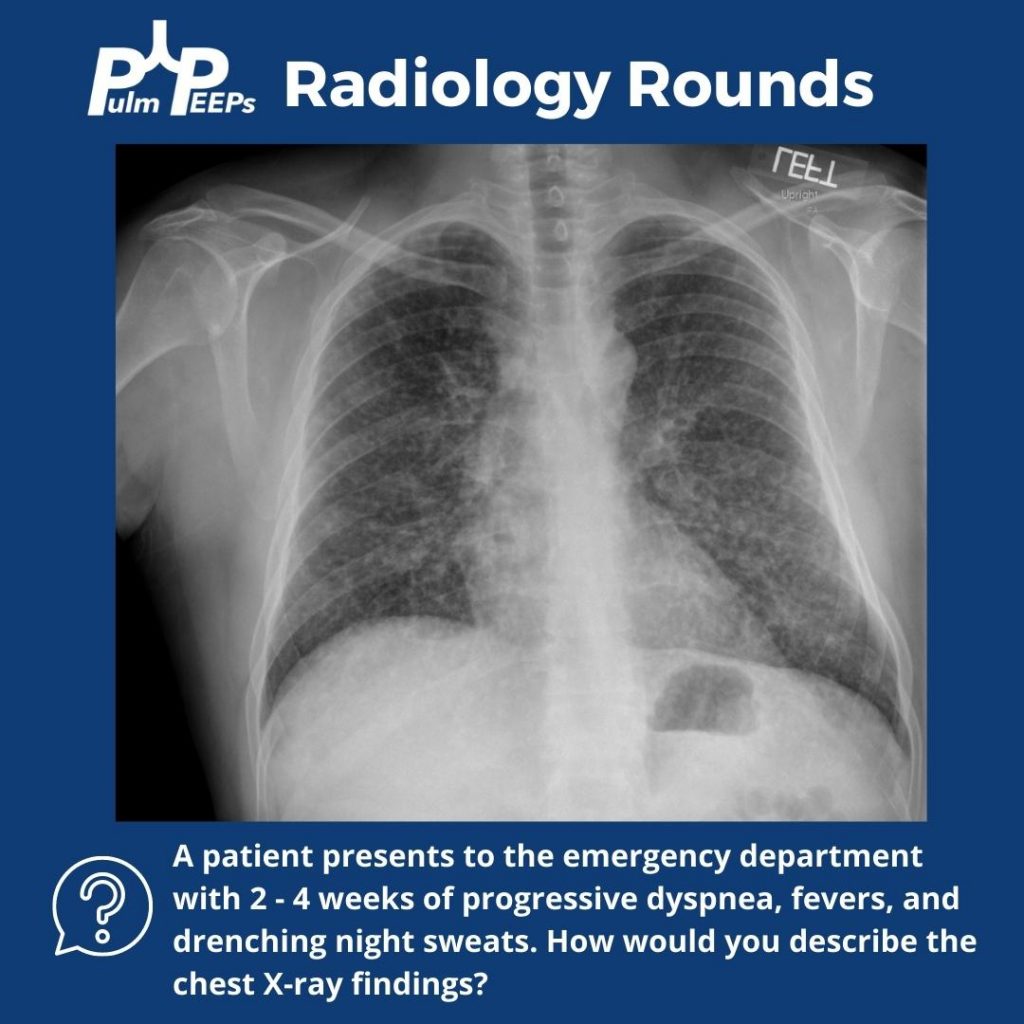
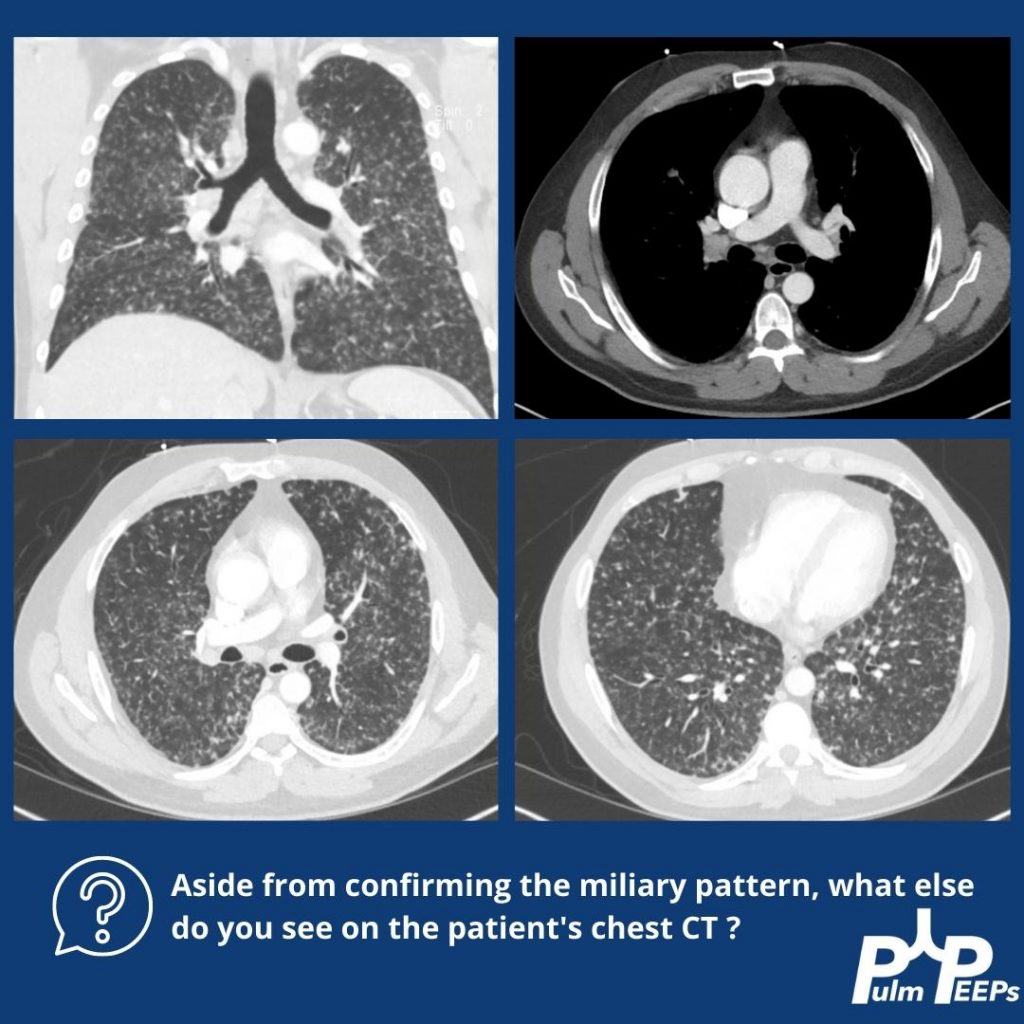
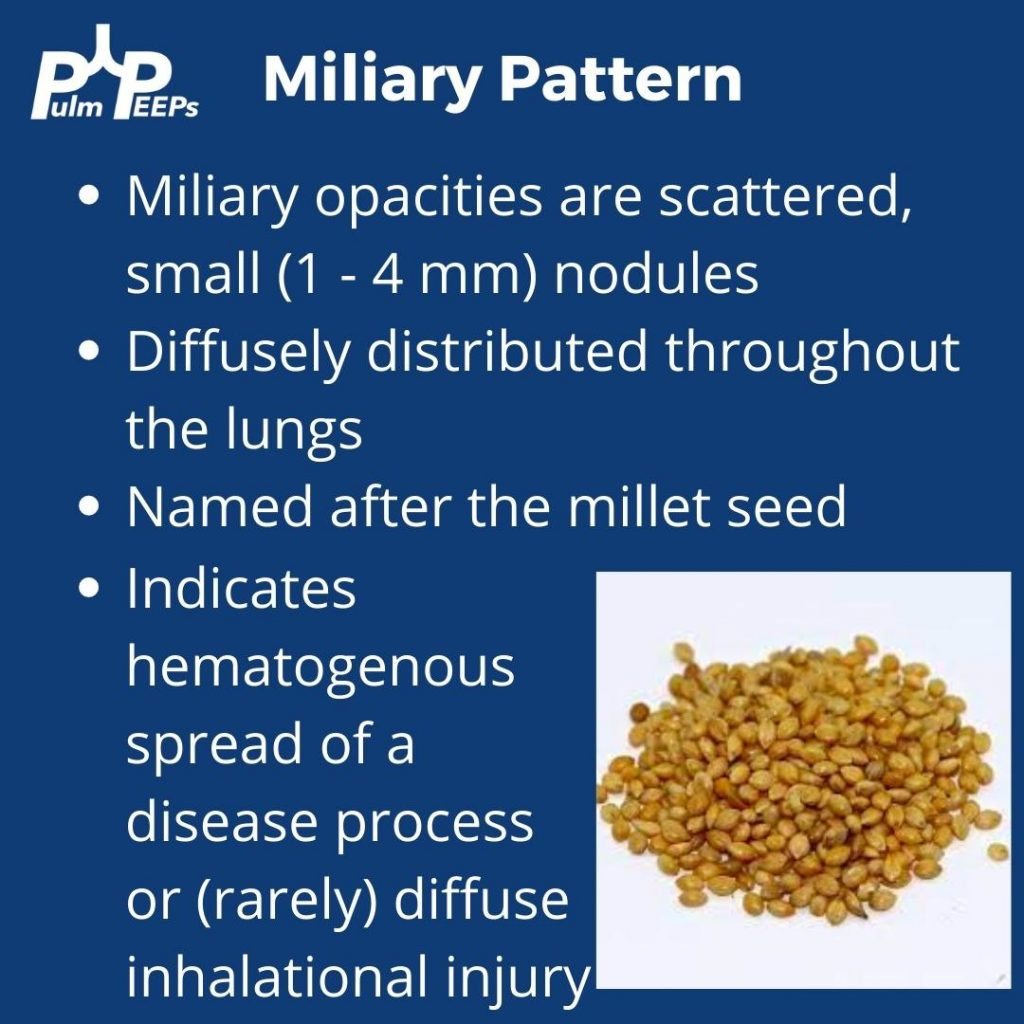
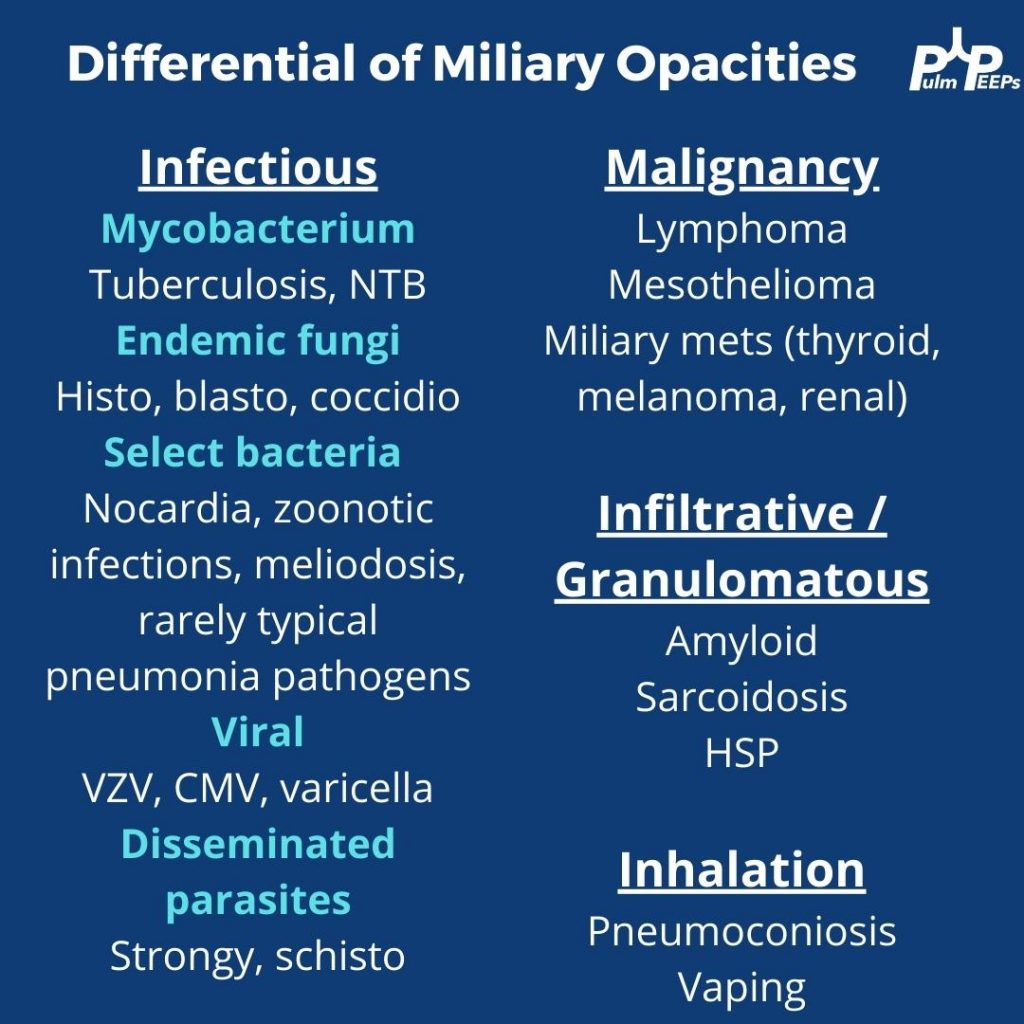
This week we’re sharing a distinct radiology pattern on chest X-ray and CT scans that should raise its own differential. Make sure to listen to our case episode next week to hear more about this patient and the diagnostic workup.

References and links for further reading

  1. Raoof S, Amchentsev A, Vlahos I, Goud A, Naidich DP. Pictorial essay: multinodular disease: a high-resolution CT scan diagnostic algorithm. Chest. 2006;129(3):805-815. doi:10.1378/chest.129.3.805
  2. Sharma BB. Miliary nodules on chest radiographs: A diagnostic dilemma. Lung India. 2015;32(5):518-520.
  3. Threadcraft MA, Case R. Vape-Associated Pulmonary Injury (VAPI) Presenting With a “Miliary” Pattern on Imaging. Cureus. 13(2):e13385. doi:10.7759/cureus.13385
  4. Purek L, Laroumagne S, Dutau H, Maldonado F, Astoul P. Miliary mesothelioma: a new clinical and radiological presentation in mesothelioma patients with prolonged survival after trimodality therapy. J Thorac Oncol. 2011;6(10):1753-1756. doi:10.1097/JTO.0b013e31822e295a

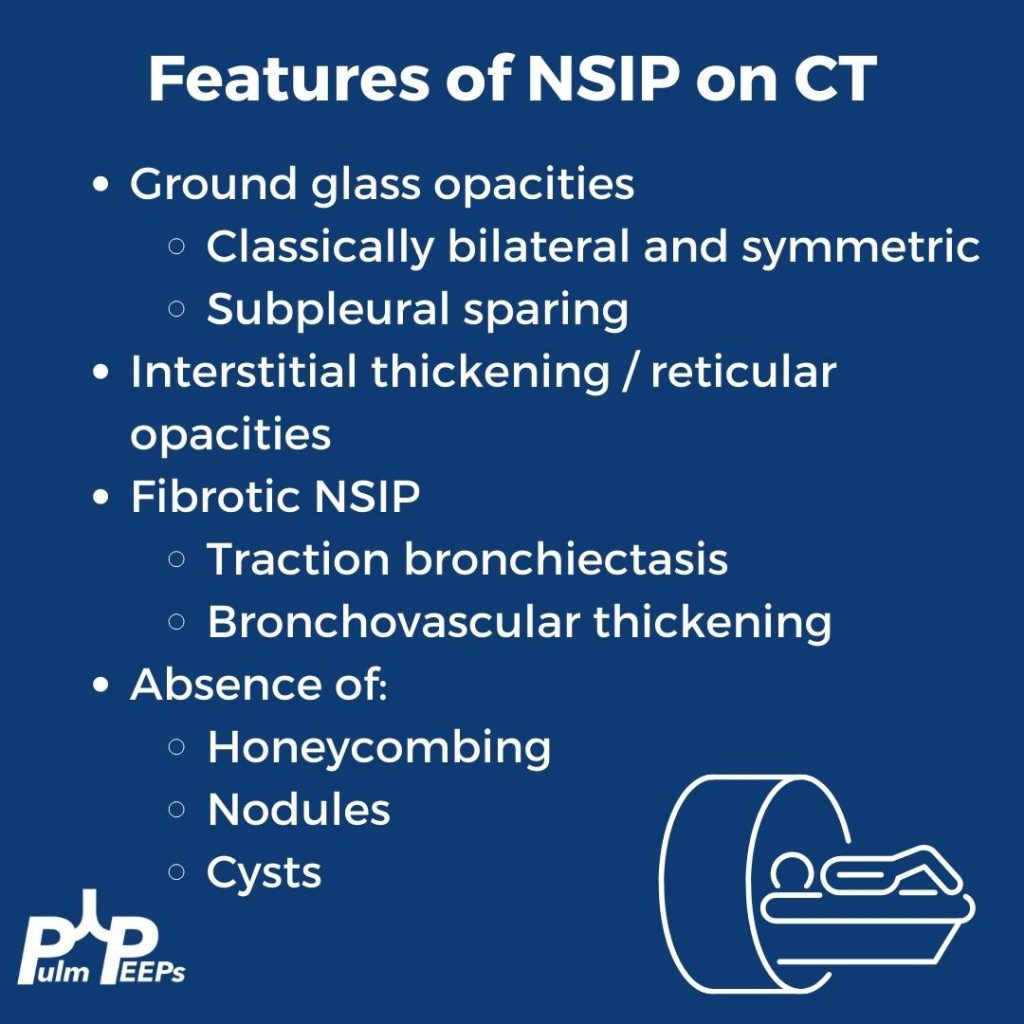
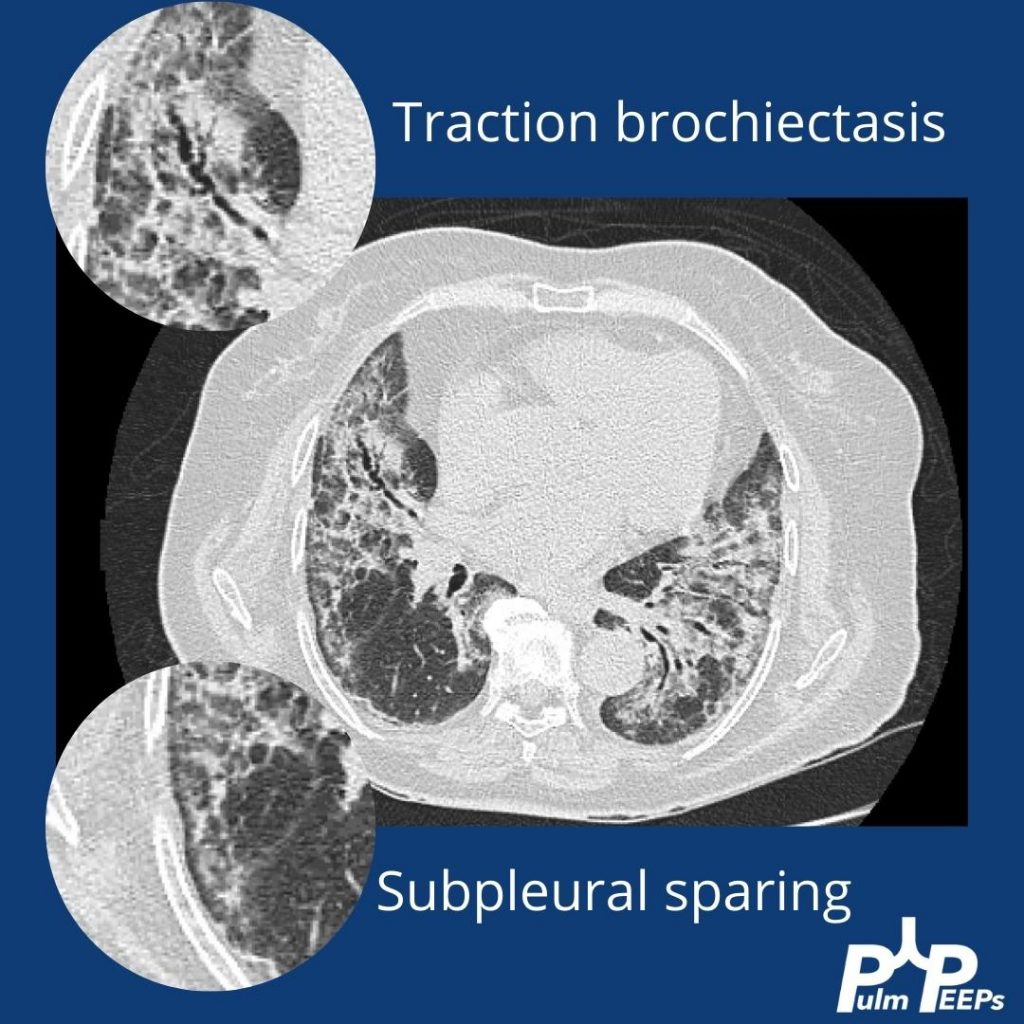
Radiology Rounds 7: Fibrotic NSIP

Fibrotic NSIP GIF

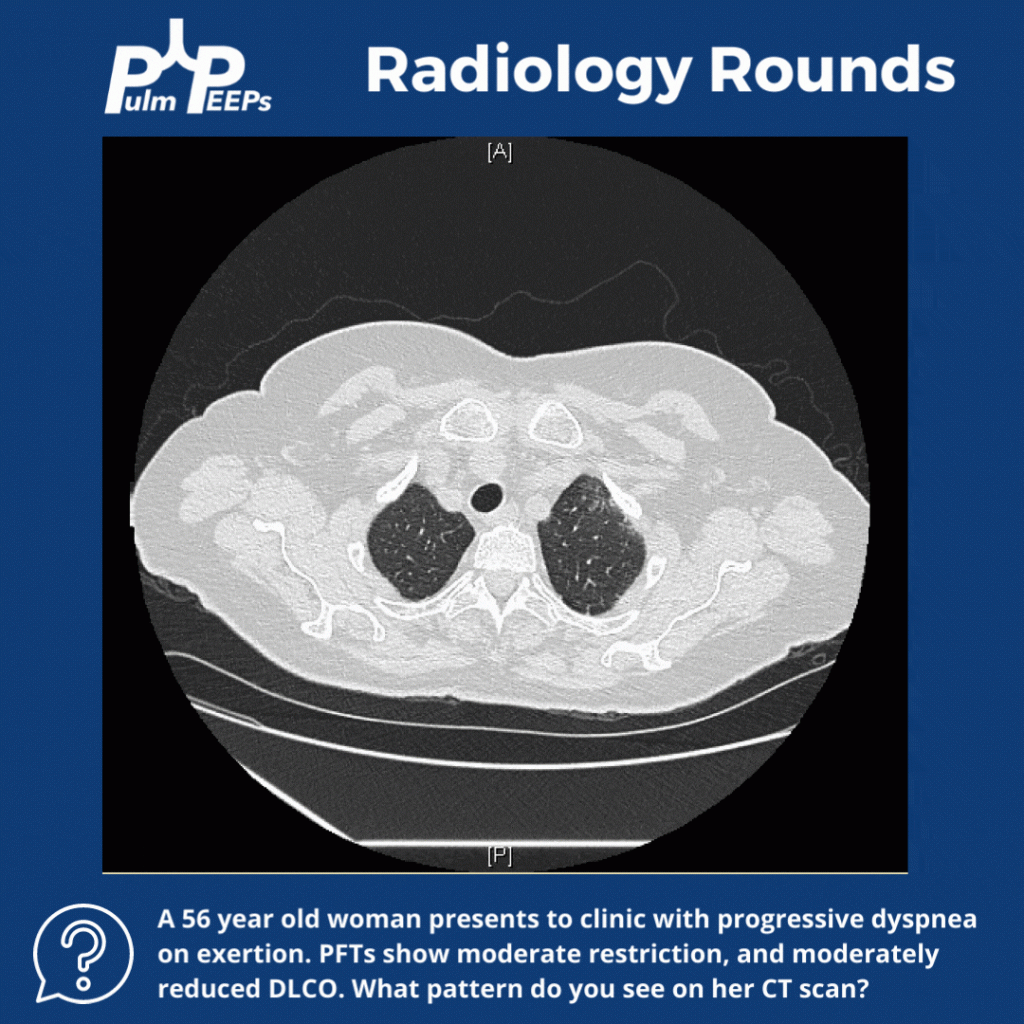
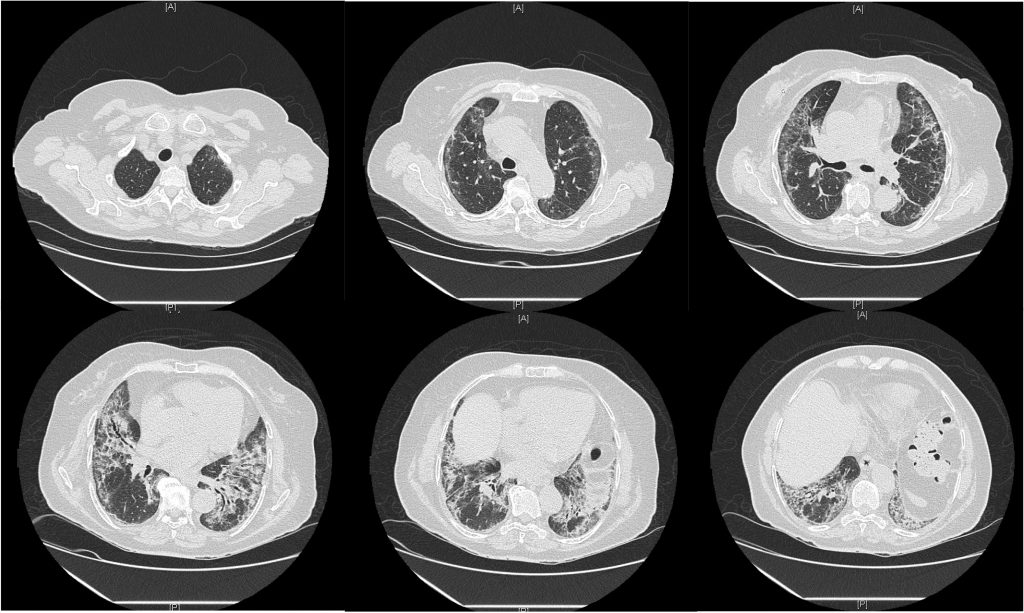
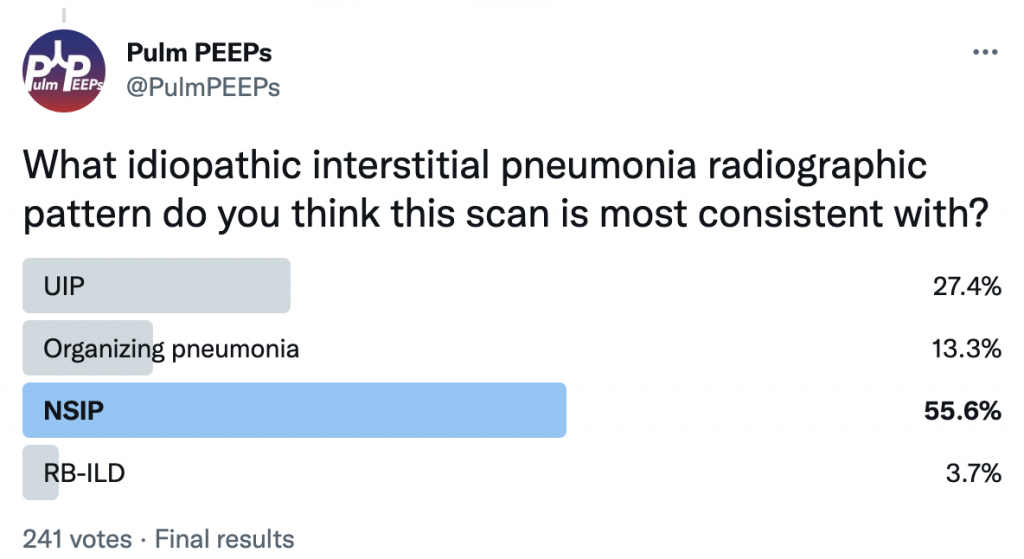
Evaluating a patient with suspected interstitial lung disease is a challenge for all pulmonary clinicians from medical students to attending physicians. This week’s Radiology Rounds covers some findings seen in one classic pattern. Make sure to listen to our show next week for more about ILD diagnosis!

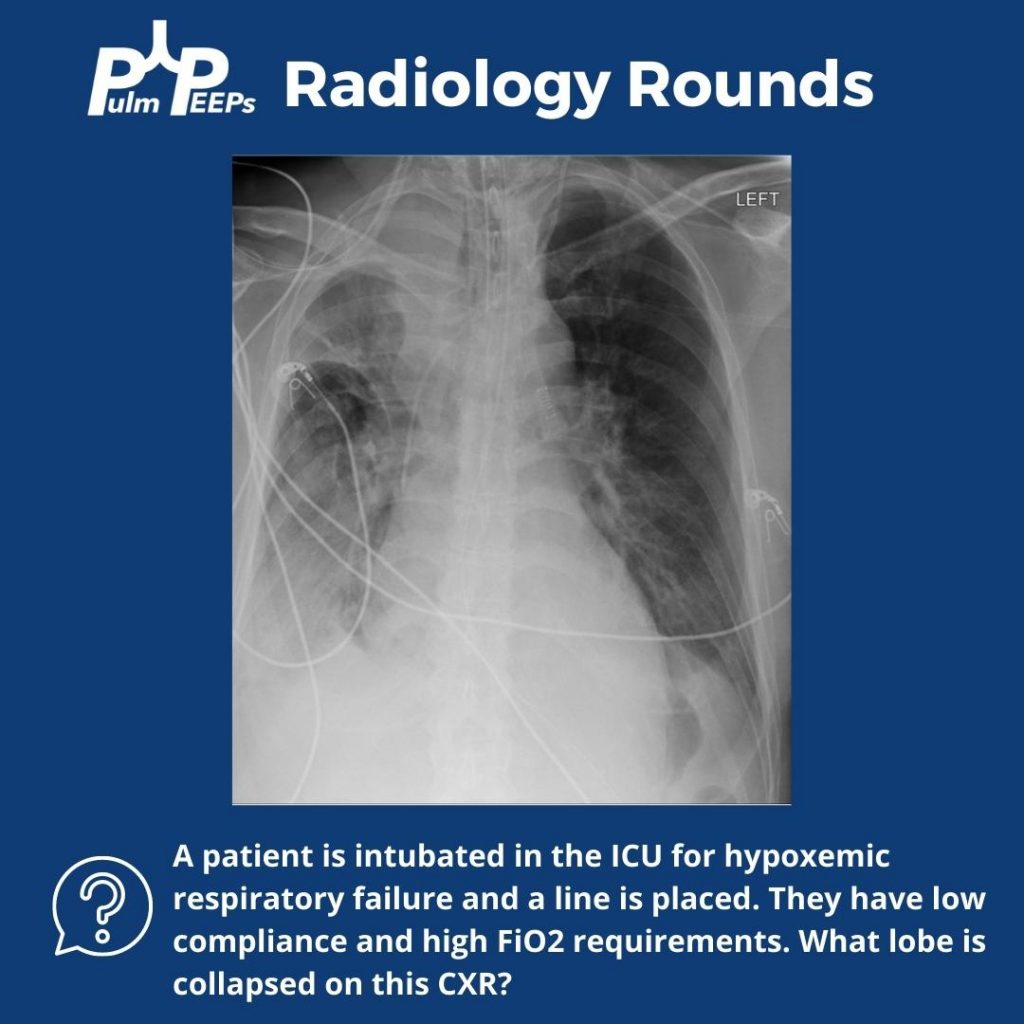
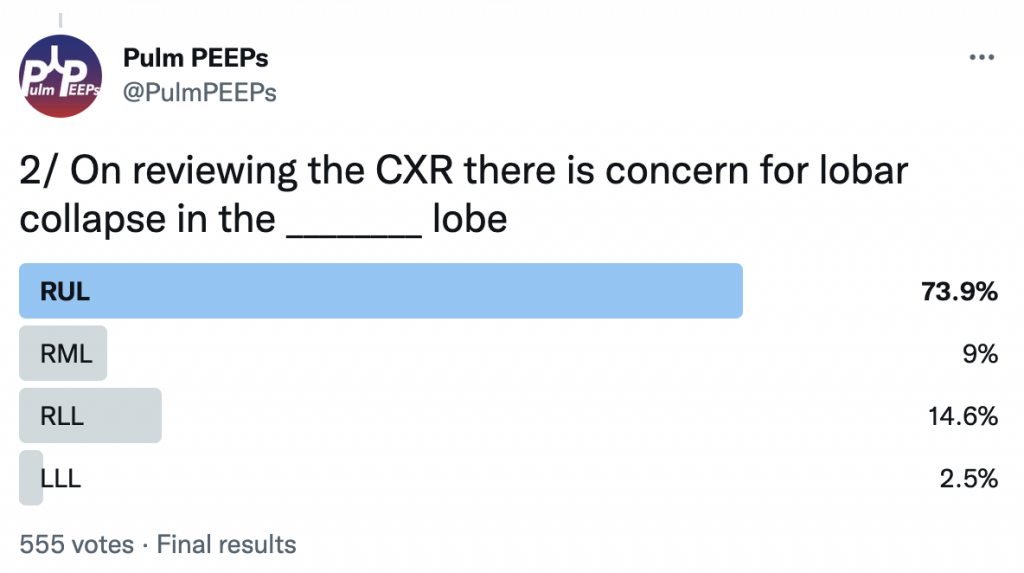
Radiology Rounds 6: Right Upper Lobe Collapse – CXR Signs

1

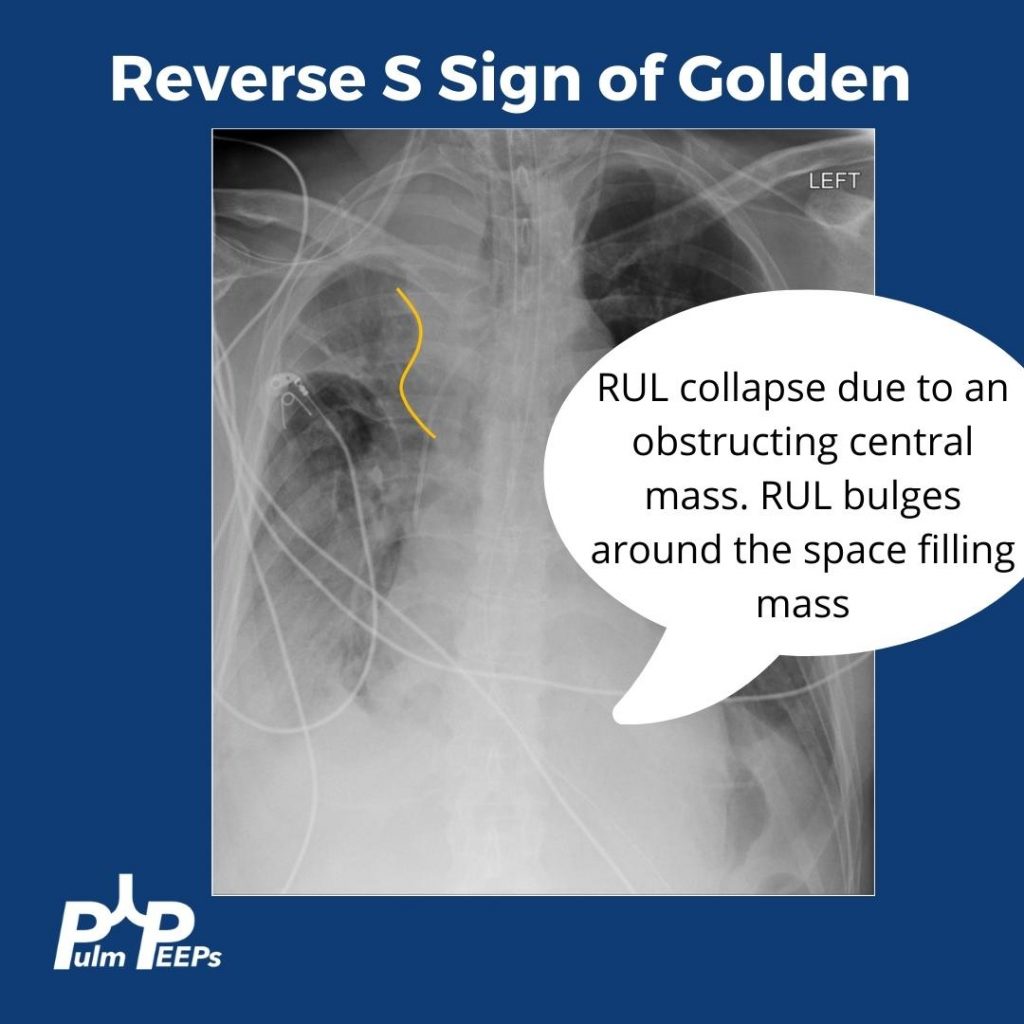
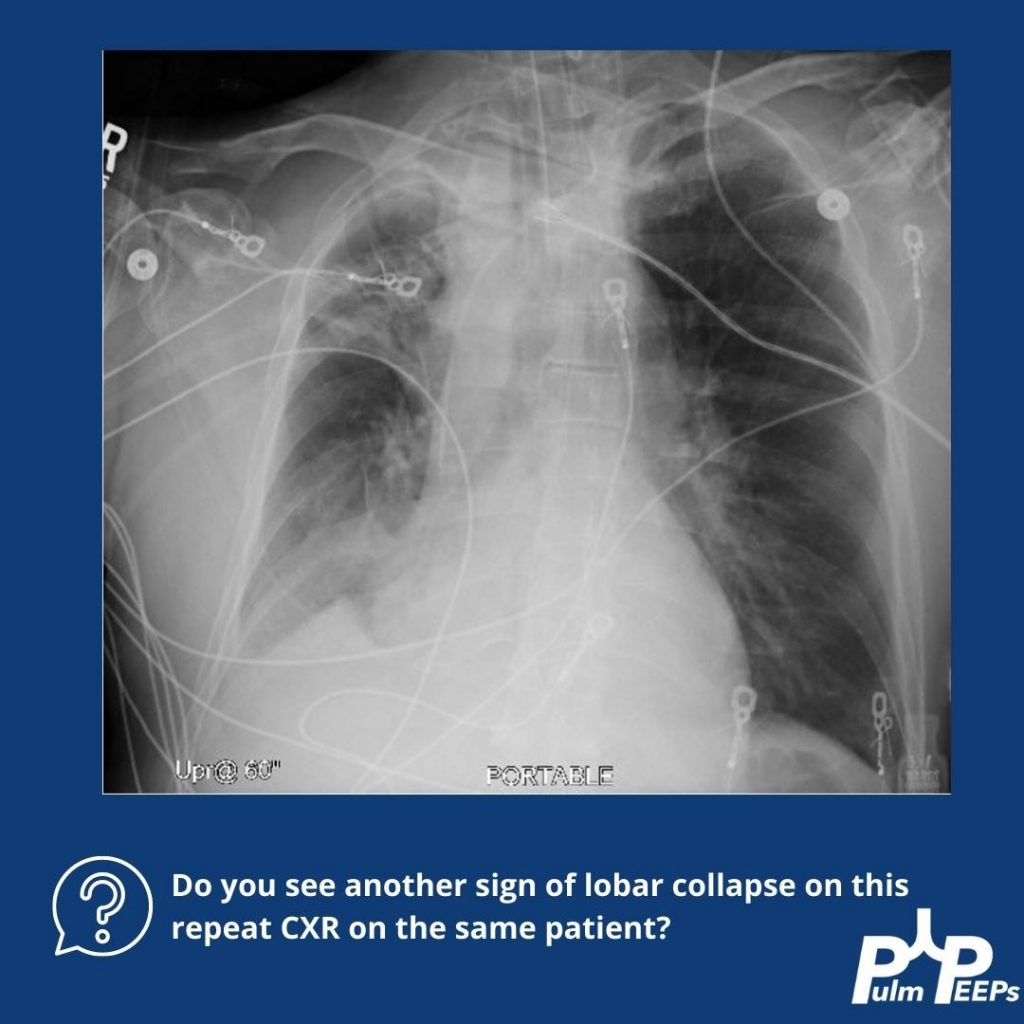
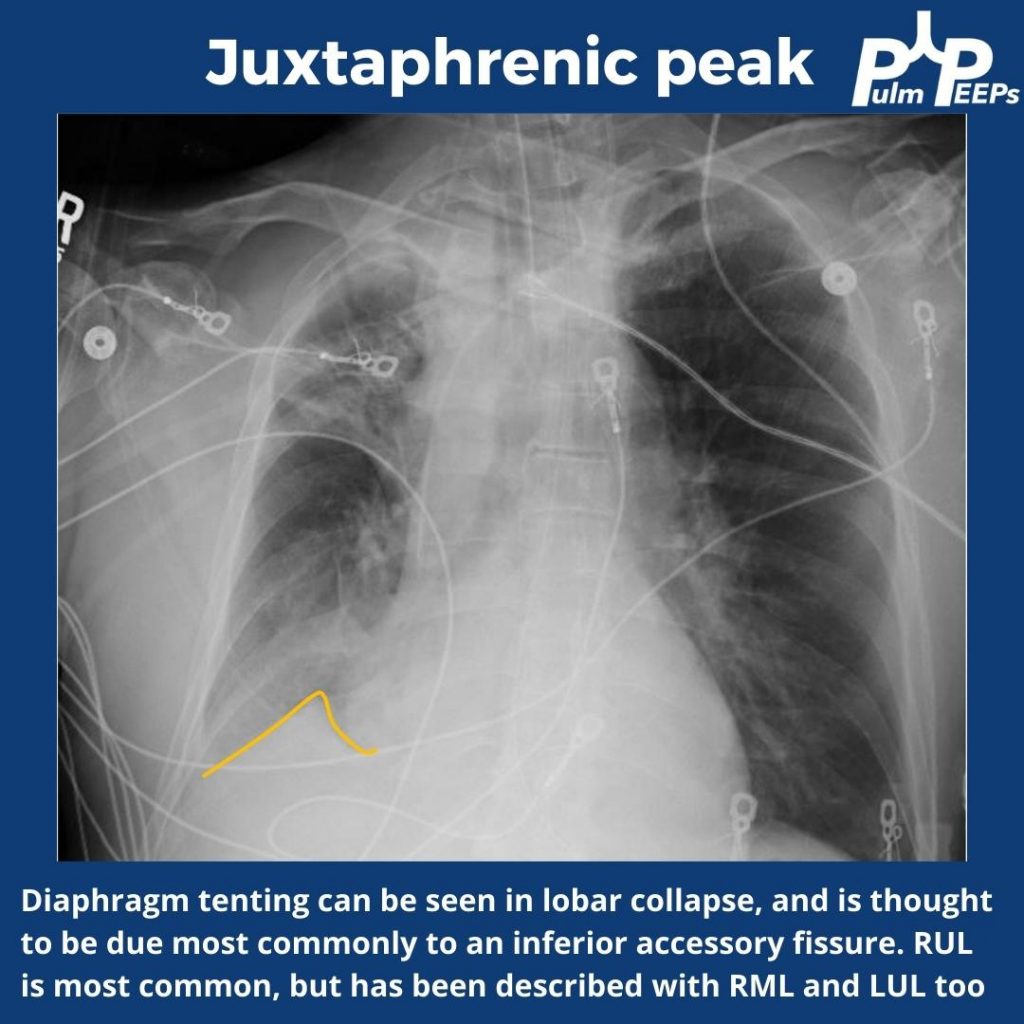
This week for radiology rounds we’re looking at some classic imaging signs of lobar collapse. Take a look, respond to our polls on Twitter, and make sure to subscribe to our podcast to get all of the Pulm PEEPs content!

References

  1. Kumaresh A, Kumar M, Dev B, Gorantla R, Sai PV, Thanasekaraan V. Back to Basics – ‘Must Know’ Classical Signs in Thoracic Radiology. J Clin Imaging Sci. 2015;5:43. doi:10.4103/2156-7514.161977
  2. Algın O, Gökalp G, Topal U. Signs in chest imaging. Diagn Interv Radiol. 2011;17(1):18-29. doi:10.4261/1305-3825.DIR.2901-09.1
  3. Gupta P. The Golden S Sign. Radiology. 2004;233(3):790-791. doi:10.1148/radiol.2333021407

Radiology Rounds 4: ARDS and Air Bronchograms

Image 1

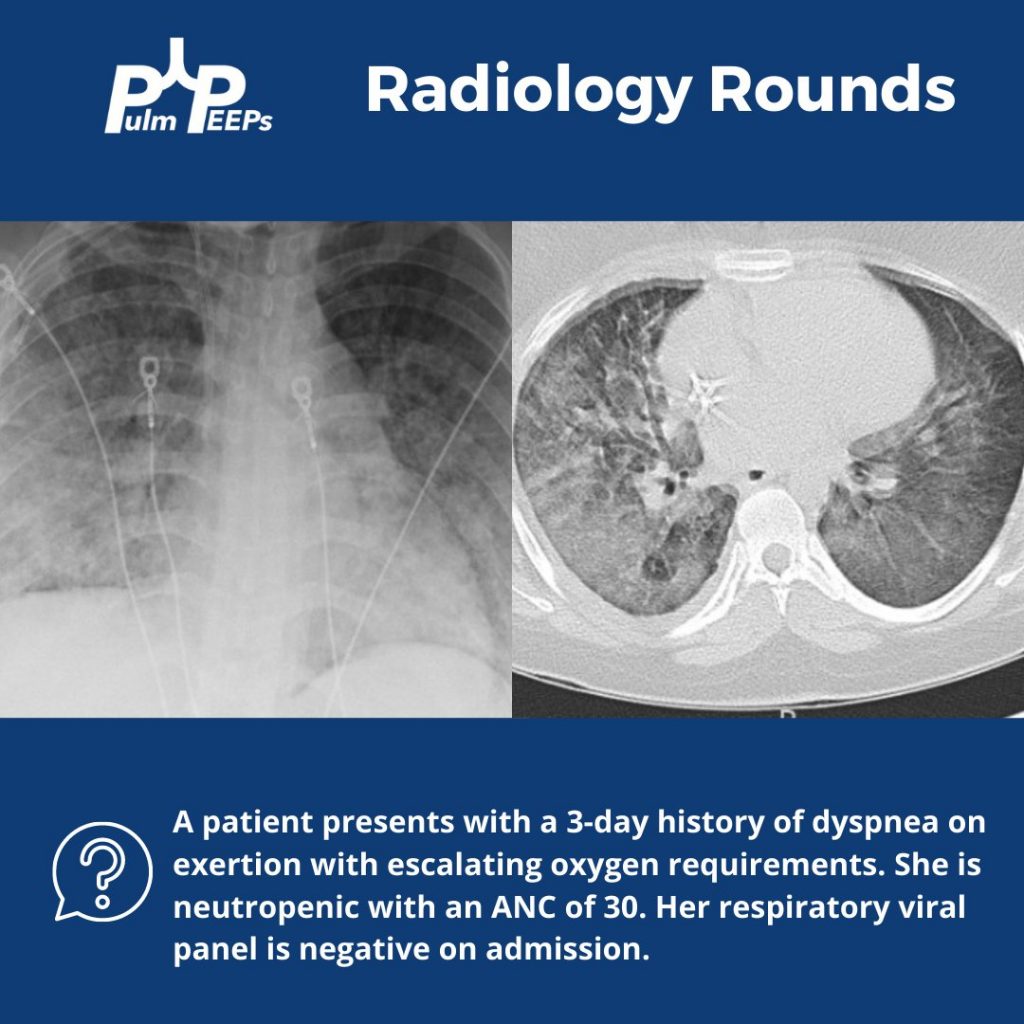
Today we’re bringing you a special edition of Radiology Rounds complete with classic imaging, and some key critical care and ventilator physiology. This case is a perfect lead-in for next week’s Pulm PEEPs Roundtable on PEEP titration, so make sure to tune in!

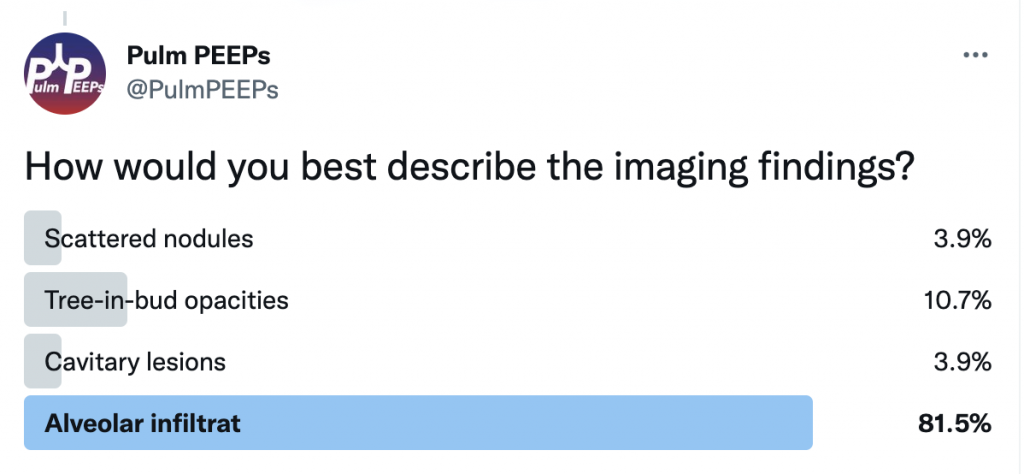
How would you best describe the imaging findings?


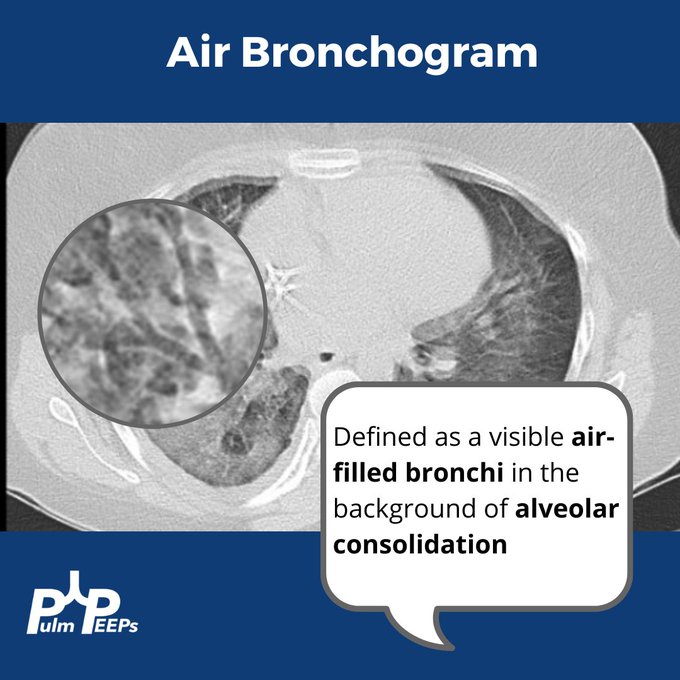
There are bilateral, diffuse alveolar infiltrates noted on imaging with evidence of an air bronchogram on the CT image.

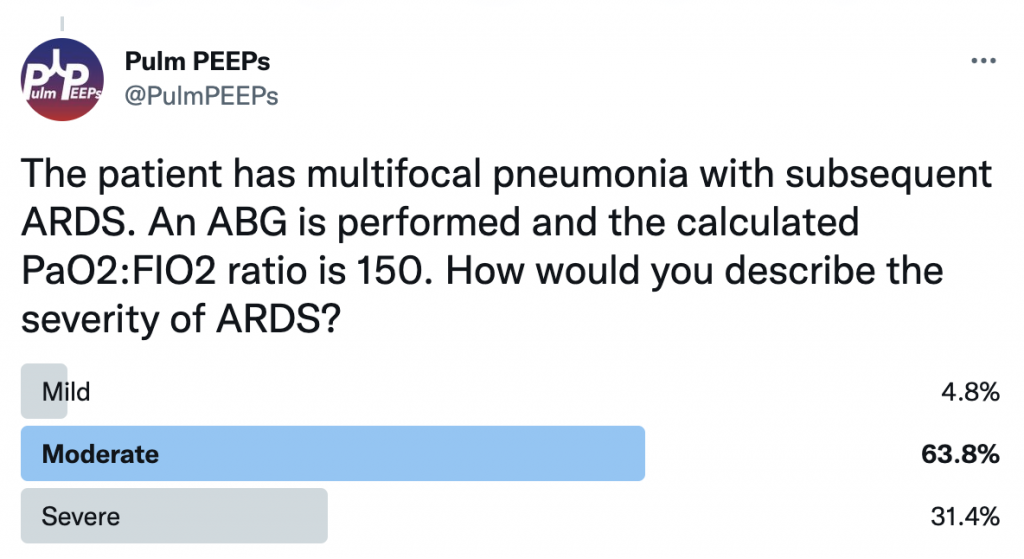
The patient develops worsening hypoxemia requiring mechanical intubation. The patient has multifocal pneumonia and requires intubation. ABG is performed and the calculated PaO2:FIO2 ratio is 150. How would you describe the severity of ARDS?


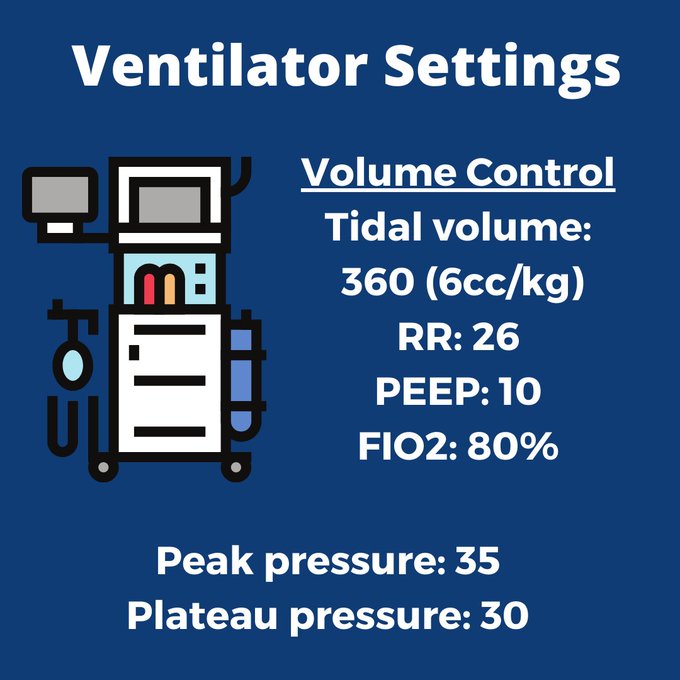
This patient has moderate ARDS based on a PaO2:FIO2 ratio that is between 100 and 200. The patient’s initial ventilator settings on volume control are:

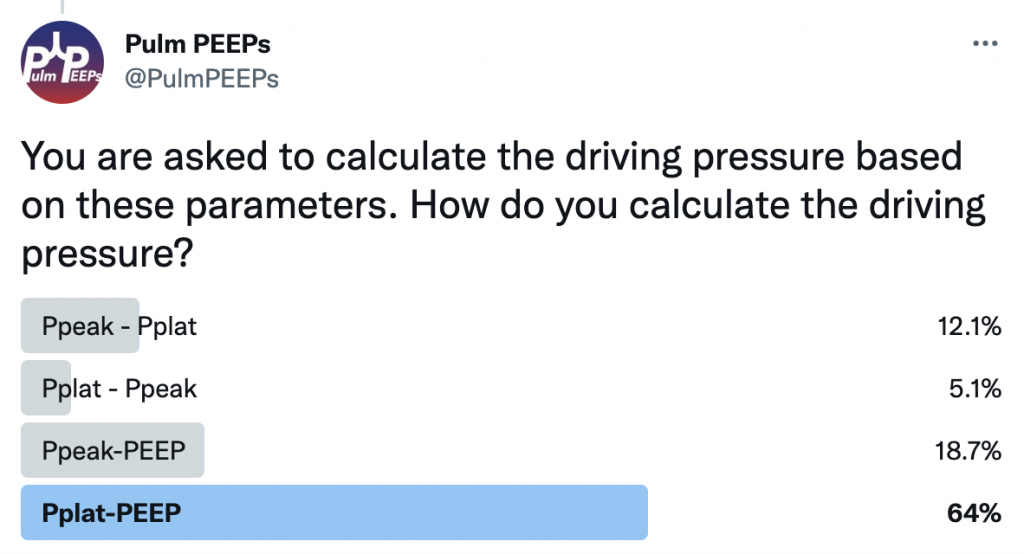
Based on these parameters, we can also calculate the driving pressure. Driving pressure is calculated by using Pplat-PEEP. In this case, Pplat (30)-PEEP (10), would give a driving pressure of 20.