
Should this patient get more fluid? It comes up on nearly every ICU shift, and the IVC is usually the first thing we scan to answer it. In this Pulm PEEPs Pearls episode, Furf and Monty cover how to get a reliable IVC view, how to read it in intubated and spontaneously breathing patients, the cutoffs worth knowing, what the data actually show, and the pitfalls that make the IVC mislead us.
Key Learning Points
Volume Responsiveness vs. Volume Status
“Volume status,” “volume depleted” and “fluid responsive” get used interchangeably on rounds, but they are not the same thing. Fluid responsiveness is a physiologic definition: a patient is fluid responsive if a fluid bolus (usually 250 to 500 mL) increases stroke volume or cardiac output by at least 10 to 15 percent. In Frank-Starling terms, you are asking whether both ventricles are still on the steep part of the curve.
Only about half of hemodynamically unstable ICU patients are fluid responsive. This has been shown again and again, going back to the classic Michard and Teboul review. If we bolus everyone who is hypotensive, roughly half get the downsides of fluid (edema, worse oxygenation, organ congestion) with none of the upside.
Responsive does not necessarily mean needs fluid. Most healthy people are fluid responsive. A patient can even be fluid responsive and volume overloaded at the same time. Responsiveness only tells you the heart can use more preload, so the decision always sits inside the clinical picture:
- Is there hypoperfusion?
- Is there reason to think low cardiac output is the problem?
- Will the patient tolerate more fluid, especially from a lung standpoint?
Why Would the IVC Tell Us Anything?
The IVC is a thin-walled, compliant vessel sitting between the abdomen and the right atrium. Its size reflects the balance between right atrial pressure on one side and intra-abdominal pressure on the other. Breathing changes the pressures around it, and how the IVC responds depends entirely on whether the patient is breathing on their own or receiving positive pressure.
- Spontaneously breathing: inspiration makes intrathoracic pressure negative, blood is pulled into the chest, and the IVC gets smaller. This is collapsibility.
- Passively ventilated: each positive-pressure breath raises intrathoracic and right atrial pressure, impeding venous return, so the IVC gets bigger on inspiration. This is distensibility.
The theory: a patient on the flat part of the Frank-Starling curve has a high right atrial pressure and a full, stiff IVC that barely moves. A patient on the steep part has a lower right atrial pressure and a more compliant IVC that swings with each breath. Lots of respiratory variation suggests fluid responsiveness; very little suggests fluid will not help.
Quick bedside trick: take a deep breath yourself. Your chest expands, your diaphragm drops, intrathoracic pressure falls and your IVC empties into the right atrium. Positive pressure is the reverse.
Getting the Image
You cannot do this well without practice, so scan your patients routinely, not only when the stakes are high.
- Probe and preset: phased array or curvilinear probe, with the abdominal or cardiac preset.
- Position: patient supine. Head position matters a little, so keep it consistent if you plan to compare scans over time.
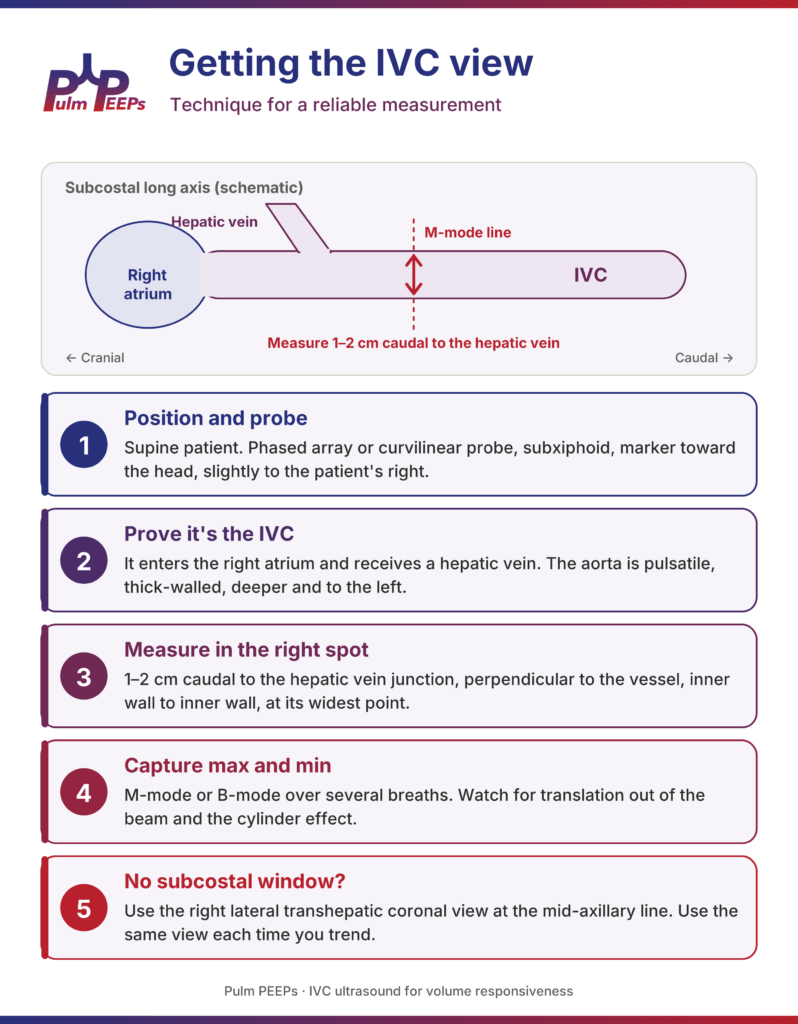
- Find the IVC: start subxiphoid, slightly to the patient’s right, with the marker toward the head in a longitudinal (sagittal) plane. Many people start with a subcostal four-chamber view of the heart, then rotate to longitudinal to bring the IVC to the center of the screen. You want to see the IVC running through the liver into the right atrium.
- Prove it’s the IVC: everyone has measured the aorta at some point. The IVC enters the right atrium and receives a hepatic vein. The aorta is thick-walled, pulsatile, deeper and to the patient’s left, and gives off the celiac and SMA rather than receiving hepatic veins. Fan over to find the aorta, or rotate to a transverse view to see both side by side. Color or pulsed-wave Doppler can help if you are unsure.
- Measure in the right spot: 1 to 2 cm caudal to the hepatic vein junction (about 2 to 3 cm from the cavoatrial junction), perpendicular to the long axis of the vessel, inner wall to inner wall.
- Capture the max and min: drop an M-mode line through that spot and record over several breaths. Many ultrasound machines have a built-in calculation package that will compute the index for you once you mark the maximum and minimum.
- Watch for translation: the IVC moves with the diaphragm and can slide in and out of the M-mode line, which can look like collapse. Watch the B-mode clip, or measure in B-mode at a fixed anatomic landmark.
- Avoid the cylinder effect: the IVC is a tube. A slice through its edge underestimates the diameter and can exaggerate collapse. Fan through the vessel and measure at its widest point.
- No subcostal window? Post-op abdomen, body habitus and bowel gas are common in the ICU. Use the right lateral transhepatic coronal view at the mid-axillary line, using the liver as your window (the same view used in VExUS). Measurements are not perfectly interchangeable with the subcostal view, so use the same view each time you trend. If you cannot get confident landmarks, this may not be the right test for this patient.
The Intubated Patient: Distensibility
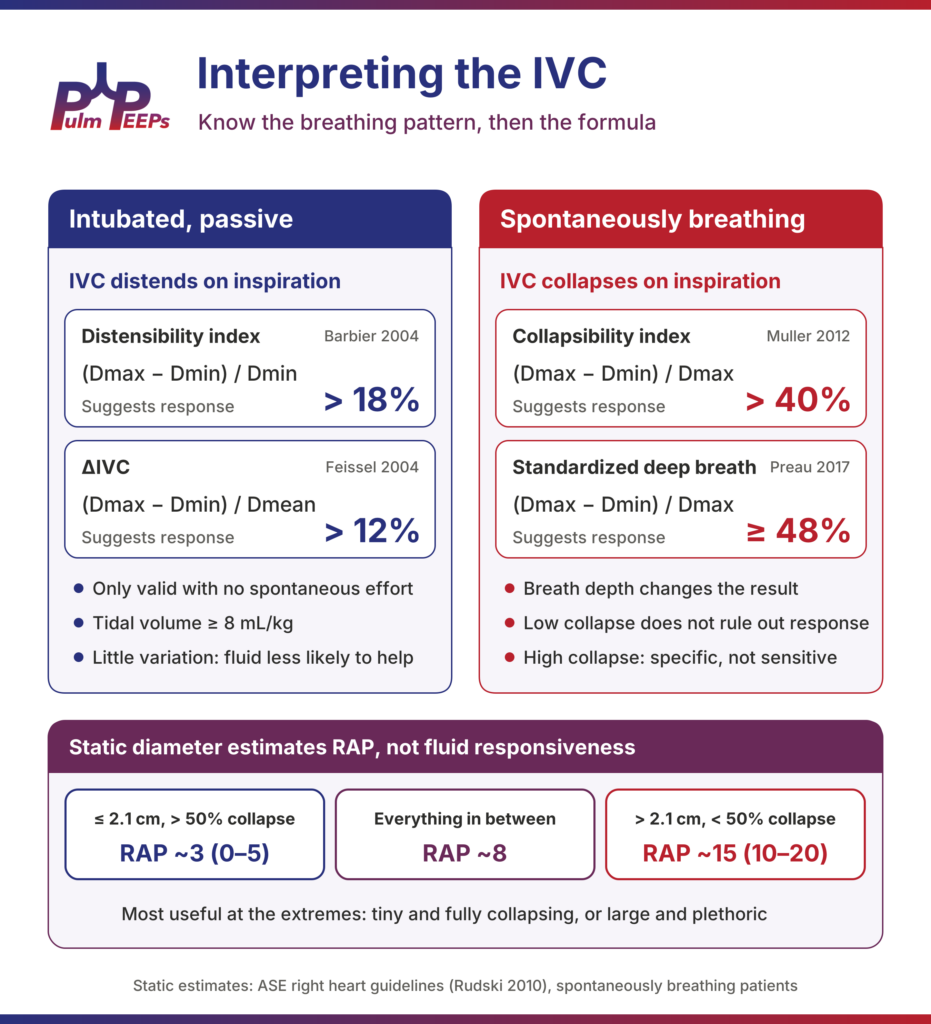
The IVC works best in mechanically ventilated patients because we control the breath. Two classic indices, both from 2004 and both in French septic shock patients, give us the numbers most people quote:
| Index | Formula | Cutoff suggesting response | Study |
| Distensibility index (dIVC) | (Dmax − Dmin) / Dmin | > 18% | Barbier 2004, n = 23: sensitivity and specificity ~90% |
| ΔIVC | (Dmax − Dmin) / Dmean | > 12% | Feissel 2004, n = 39: PPV 93%, NPV 92% |
Match the formula to the cutoff. Mixing them up is one of the most common errors. The easy way to remember it: 18 percent if you divide by the minimum, 12 percent if you divide by the mean. If your machine calculates the index, check which formula it uses.
Know the conditions these were validated in. Patients were fully passive on the ventilator, in volume control, with tidal volumes of about 8 to 10 mL/kg. In today’s ICU, with lung-protective ventilation at 6 mL/kg and patients often triggering breaths, those conditions frequently do not apply. Choose your patient carefully: passive on the vent, with an adequate tidal volume.
The Spontaneously Breathing Patient: Collapsibility
In the ED or on the floor, we are looking at collapsibility (the caval index): (Dmax − Dmin) / Dmax. Here the story gets messier. We do not control the rate or the effort, and a small shallow breath versus a big deep sniff gives very different collapsibility in the same patient at the same volume status. Many septic patients are also breathing hard, which changes intrathoracic dynamics considerably.
Three studies are worth knowing:
- Muller 2012 (n = 40, acute circulatory failure): collapsibility > 40% had a sensitivity of 70% and specificity of 80%. A value below 40% did not rule out fluid responsiveness.
- Airapetian 2015 (n = 59): overall performance was poor (AUC 0.62), but collapsibility > 42% was very specific (97%) with a sensitivity of only 31%.
- Preau 2017 (n = 90, septic, non-intubated): standardizing the breath, a deep inspiration followed by passive exhalation, collapsibility ≥ 48% had a sensitivity of 84%, specificity of 90% and AUC of 0.89.
The practical takeaway: near-complete collapse, over 40 to 50 percent, especially with a standardized deep breath, makes fluid responsiveness more likely. A big number means something; a small number does not tell you much. And anyone can collapse their IVC if they are breathing hard enough, so in true respiratory distress this test is of little use.
What About Just the Size of the IVC?
“The IVC is flat, give fluid” is still heard on rounds, but the static diameter answers a different question. It comes from the echo world, where it is used to estimate right atrial pressure in spontaneously breathing patients, many of them outpatients. Per the American Society of Echocardiography right heart guidelines (Rudski 2010):
| IVC diameter and sniff collapse | Estimated RAP (mmHg) |
| ≤ 2.1 cm and > 50% collapse | ~3 (0–5) |
| Everything in between | ~8 |
| > 2.1 cm and < 50% collapse | ~15 (10–20) |
Estimating right atrial pressure is not predicting fluid responsiveness. Decades of ICU data show that static pressures, even a directly measured CVP, are poor predictors of fluid responsiveness. This takes us right back to the difference between volume status and volume responsiveness.
The static IVC is most useful at the extremes. A tiny, nearly virtual IVC (under about 1 cm) in a hypotensive patient makes fluid responsiveness more likely. A large, non-collapsing IVC should make you pause and think about the right heart, tamponade or volume overload. As with our FeNO episode, the extremes are informative and the middle is gray.
What Do the Data Show?
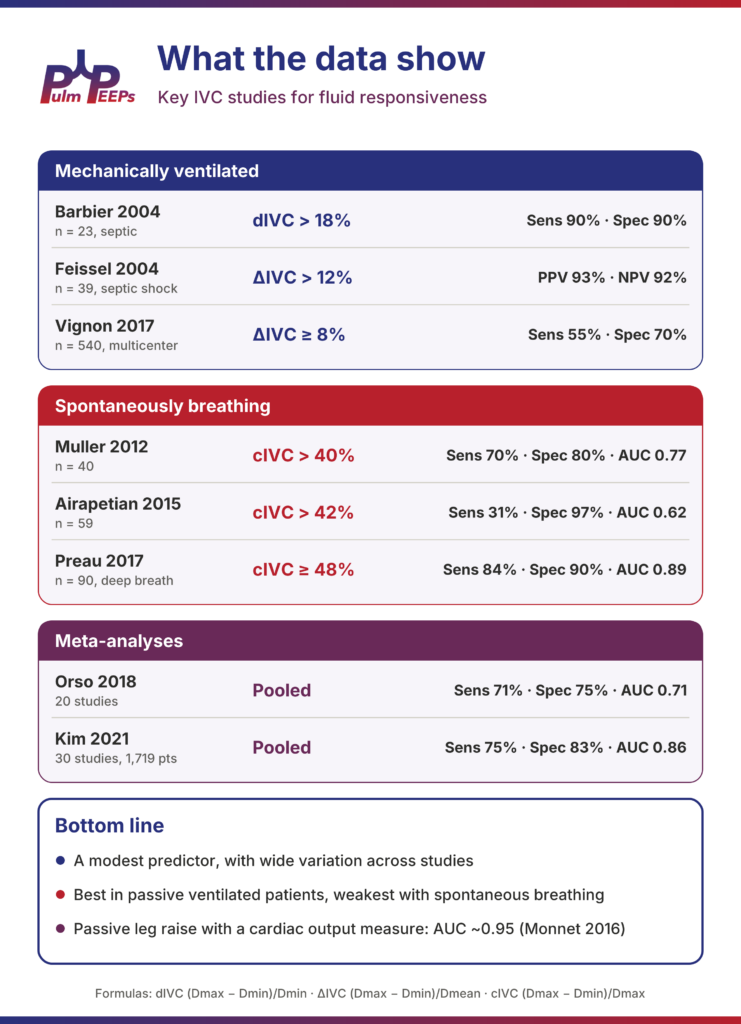
The IVC is a modest predictor of fluid responsiveness, with wide variation across studies. Performance is best in passive ventilated patients and weakest with spontaneous breathing:
| Study | Population | Index and cutoff | Performance |
| Barbier 2004 | 23 ventilated, septic | dIVC > 18% | Sens 90%, spec 90% |
| Feissel 2004 | 39 ventilated, septic shock | ΔIVC > 12% | PPV 93%, NPV 92% |
| Vignon 2017 | 540 ventilated, multicenter | ΔIVC ≥ 8% | Sens 55%, spec 70% |
| Muller 2012 | 40 spontaneously breathing | cIVC > 40% | Sens 70%, spec 80%, AUC 0.77 |
| Airapetian 2015 | 59 spontaneously breathing | cIVC > 42% | Sens 31%, spec 97%, AUC 0.62 |
| Preau 2017 | 90 spontaneously breathing, deep breath | cIVC ≥ 48% | Sens 84%, spec 90%, AUC 0.89 |
| Orso (meta-analysis) | 20 studies | Pooled | Sens 71%, spec 75%, AUC 0.71 |
| Kim 2021 (meta-analysis) | 30 studies, 1,719 patients | Pooled | Sens 75%, spec 83%, AUC 0.86 |
Note how much the large multicenter Vignon cohort pulls the ventilated numbers down compared with the small original studies. The meta-analyses are mixed and very heterogeneous: Orso and colleagues concluded the IVC is not a reliable predictor on its own, while Kim and colleagues found better pooled accuracy. Both pointed to huge variation in patient populations, formulas, cutoffs and how responsiveness was defined.
Putting it together: the IVC is fast, noninvasive and repeatable, and it is a useful piece of the puzzle. It should never be the only thing driving the decision to give fluid. When it really matters, a passive leg raise paired with a measure of cardiac output performs far better (pooled AUC ~0.95, Monnet 2016). We will cover LVOT VTI, pulse pressure variation and VExUS in future episodes.
Pitfalls: When the IVC Can Mislead You
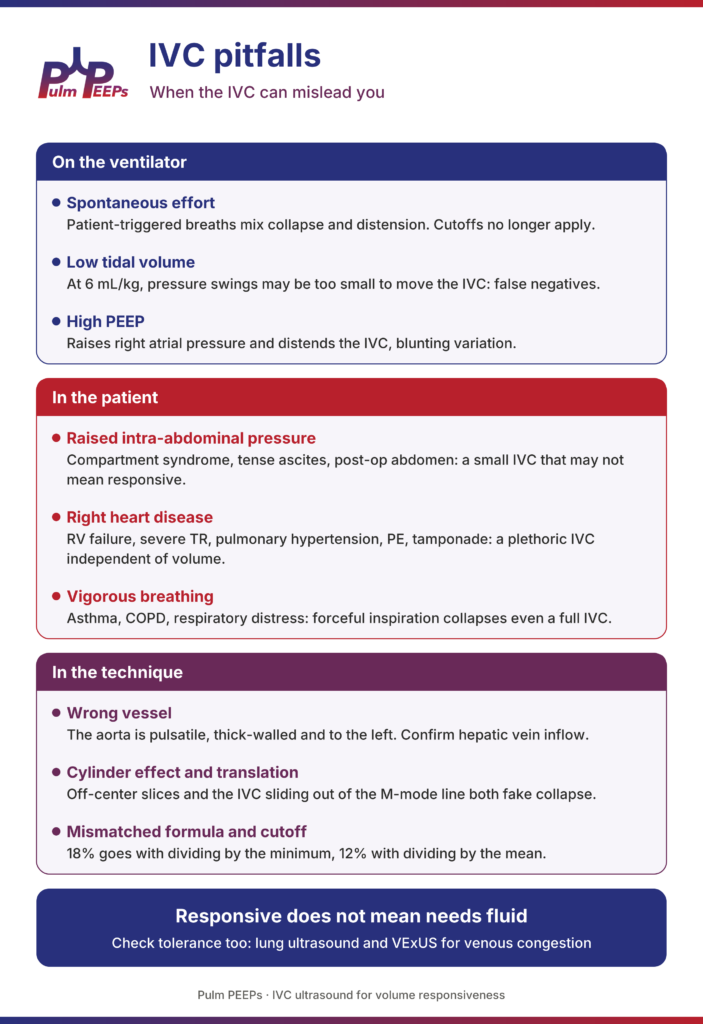
The patients we most want to answer this question for are often the ones in whom the IVC is least reliable.
On the ventilator
- Spontaneous effort: patient-triggered breaths mix collapse and distension, and the cutoffs no longer apply.
- Low tidal volume: at 6 mL/kg, the change in intrathoracic pressure may be too small to move the IVC, causing false negatives.
- High PEEP: raises right atrial pressure on its own, distending the IVC and blunting variation.
In the patient
- Raised intra-abdominal pressure: abdominal compartment syndrome, tense ascites, bowel distension or a recent abdominal surgery can compress the IVC, so a small, collapsible IVC may not mean responsive.
- Right heart disease: RV failure, severe tricuspid regurgitation, pulmonary hypertension, PE and tamponade all give a plethoric IVC independent of volume. In tamponade or massive PE, of course, that plethoric IVC is important diagnostic information in its own right.
- Vigorous breathing: in asthma, COPD exacerbations or any respiratory distress, forceful inspiration can collapse even a full IVC, and active exhalation distorts the measurement.
In the technique
- Wrong vessel: the aorta is pulsatile, thick-walled and to the left. Confirm hepatic vein inflow.
- Cylinder effect and translation: off-center slices and the IVC sliding out of the M-mode line both fake collapse.
- Mismatched formula and cutoff: 18% goes with dividing by the minimum, 12% with dividing by the mean.
And remember: responsive does not mean needs fluid. Check tolerance too, with lung ultrasound and VExUS for venous congestion.
The Five Pulm PEEPs Pearls
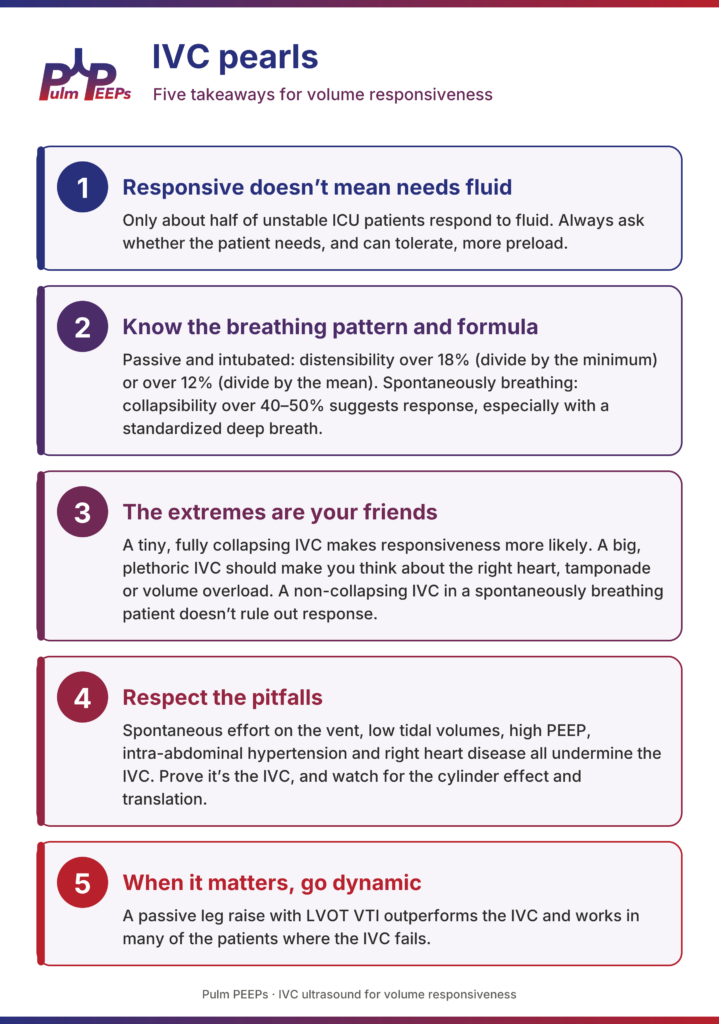
- Fluid responsive doesn’t mean fluid needed. Only about half of unstable ICU patients respond to fluid, and responsiveness is only one part of the decision. Always ask whether the patient needs, and can tolerate, more preload.
- Know the breathing pattern and the formula. Passive and intubated: distensibility over 18% (divide by the minimum) or over 12% (divide by the mean). Spontaneously breathing: collapsibility over 40 to 50% suggests response, especially with a standardized deep breath.
- The extremes are your friends. A tiny, fully collapsing IVC makes responsiveness more likely. A big, plethoric IVC should make you think about the right heart, tamponade or volume overload. A non-collapsing IVC in a spontaneously breathing patient doesn’t rule out response.
- Respect the pitfalls. Spontaneous effort on the vent, low tidal volumes, high PEEP, intra-abdominal hypertension and right heart disease all undermine the IVC, and they are common in our sickest patients. Prove it’s the IVC, and watch for the cylinder effect and translation.
- When it matters, go dynamic. A passive leg raise with LVOT VTI outperforms the IVC and works in many of the patients where the IVC fails.
Scan carefully, interpret in context, and as always, keep breathing!
References and Further Reading
- Michard F, Teboul JL. “Predicting fluid responsiveness in ICU patients: a critical analysis of the evidence.” Chest. 2002;121(6):2000–2008.
- Barbier C, Loubières Y, Schmit C, et al. “Respiratory changes in inferior vena cava diameter are helpful in predicting fluid responsiveness in ventilated septic patients.” Intensive Care Med. 2004;30(9):1740–1746.
- Feissel M, Michard F, Faller JP, Teboul JL. “The respiratory variation in inferior vena cava diameter as a guide to fluid therapy.” Intensive Care Med. 2004;30(9):1834–1837.
- Muller L, Bobbia X, Toumi M, et al. “Respiratory variations of inferior vena cava diameter to predict fluid responsiveness in spontaneously breathing patients with acute circulatory failure: need for a cautious use.” Crit Care. 2012;16(5):R188.
- Airapetian N, Maizel J, Alyamani O, et al. “Does inferior vena cava respiratory variability predict fluid responsiveness in spontaneously breathing patients?” Crit Care. 2015;19:400.
- Preau S, Bortolotti P, Colling D, et al. “Diagnostic accuracy of the inferior vena cava collapsibility to predict fluid responsiveness in spontaneously breathing patients with sepsis and acute circulatory failure.” Crit Care Med. 2017;45(3):e290–e297.
- Vignon P, Repessé X, Bégot E, et al. “Comparison of echocardiographic indices used to predict fluid responsiveness in ventilated patients.” Am J Respir Crit Care Med. 2017;195(8):1022–1032.
- Orso D, Paoli I, Piani T, et al. “Accuracy of ultrasonographic measurements of inferior vena cava to determine fluid responsiveness: a systematic review and meta-analysis.” J Intensive Care Med. 2020;35(4):354–363.
- Kim DW, Chung S, Kang WS, Kim J. “Diagnostic accuracy of ultrasonographic respiratory variation in the inferior vena cava, subclavian vein, internal jugular vein, and femoral vein diameter to predict fluid responsiveness: a systematic review and meta-analysis.” Diagnostics (Basel). 2021;12(1):49.
- Rudski LG, Lai WW, Afilalo J, et al. “Guidelines for the echocardiographic assessment of the right heart in adults.” J Am Soc Echocardiogr. 2010;23(7):685–713.
- Monnet X, Marik P, Teboul JL. “Passive leg raising for predicting fluid responsiveness: a systematic review and meta-analysis.” Intensive Care Med. 2016;42(12):1935–1947.